The supply of homes available to buy in the 13-county Twin Cities region hit a record low in January. The scarcity could lead to higher home prices and that, in turn, could lead to affordability issues for many potential homebuyers, according to a monthly analysis conducted by the Shenehon Center for Real Estate at the University of St. Thomas’ Opus College of Business.
Each month the center tracks the median price for three types of sales: nondistressed or traditional; foreclosures; and short sales (when a home is sold for less than the outstanding mortgage balance). In addition, it looks for trends in the market and creates a monthly composite index score by tracking nine data elements for those three types of sales.
Herb Tousley, director of real estate programs at the university, said that while many of the statistics for January look promising, the record-low inventory is cause for concern.
“In many respects, January 2016 has been a good start to the new year. Year-over-year median sale prices ended at $215,000, a 10.4 percent increase compared to January 2015. The number of closed sales was 18.3 percent higher than last January and the percentage of distressed home sales remains at near pre-crash levels,” he said.
“However, the number of homes for sale in January set a new low-record level at 10,131. That is 4 percent less than last month and 21.7 percent less than a year ago. As might be expected, the average-days-on-the-market at 85 and the months’ supply at 2.1 months are significantly lower than last year.”
So, why is this a problem?
“If current levels continue, the low inventory of homes for sale will lead to more of an imbalance in the market,” Tousley said. “As we move into the spring and summer markets more people will be looking for homes to buy. If there are not significantly more homes available for sale it will begin to be a drag on the number of closed sales and prices will begin to increase at a faster rate making it harder for buyers to afford a home.”
While higher prices will be good for sellers, it will especially impact first-time and first-move-up buyers.
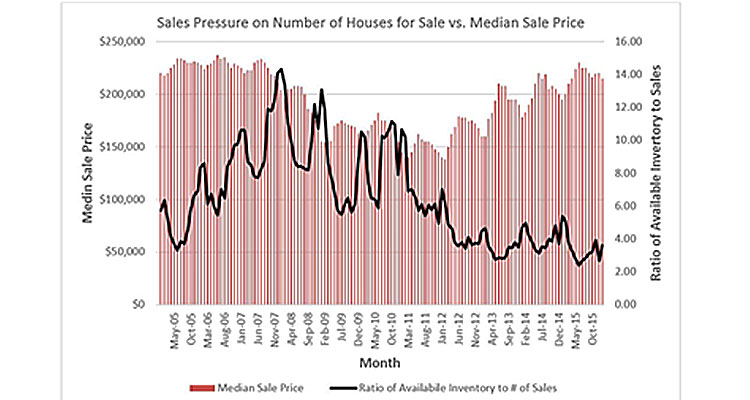
The Shenehon Center examined the historical relationship in the Twin Cities between the number of homes for sale, the number of homes sold and the median sale prices. The center found that when the market gets tighter – or in other words when buyers increasingly outnumber sellers – the median sale price of homes increases.
“According to MLS (Multiple Listing Services) data, the median sale price of all homes sold in the Twin Cities in 2015 increased 6.4 percent. During the same period, data from Housing and Urban Development indicated that median household income increased by 4.5 percent,” Tousley said. “If median home sale prices increase at a faster pace than median income, over time it begins to create affordability issues for homebuyers.”
Tousley said that the Twin Cities traditionally has had an affordable housing market and that people with a median income could afford to buy a home at the median sale price. That’s not the case in many metro areas, however.
“We will be watching the ratio closely in the coming months,” he said. “Normally in the spring and early summer seasons more homes will be listed for sale and rising prices should encourage homeowners to list their homes.
“The question,” Tousley asked, “will there be enough homes listed to keep the market in balance?”
To see a chart that shows the relationship to the number of homes on the market to the median selling price, and some examples of median home prices across the United States, visit the Shenehon Center’s online report for January on its website here.
The report is available free via email from Tousley at hwtousley1@stthomas.edu.
The St. Thomas indexes
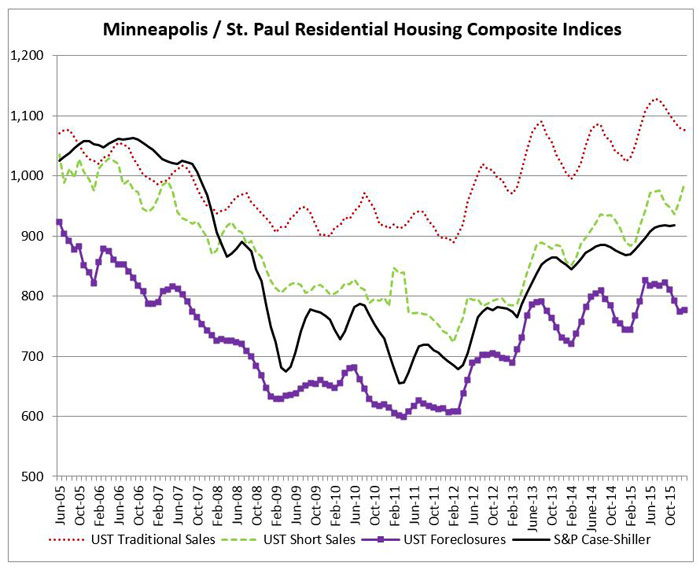
Here are the Shenehon Center’s monthly composite index scores for January 2016. The index, which tracks nine data elements for the three types of sales (traditional, short sales and foreclosures), started in January 2005. For that month, the center gave each of the three indexes a value of 1,000.
The January 2016 index score for traditional sales was 1,076, down .5 percent from December 2015 but up 5.1 percent from January 2015.
The January 2016 index score for short sales was 988, up 3.1 percent from December 2015 and up 6.4 percent compared to January 2015.
The January 2016 index score for foreclosures was 777, up slightly from 774 recorded in December 2015.
The number of short sales in January was 3 percent of total sales and the number of foreclosure sales represented 11.1 percent of the total sales.