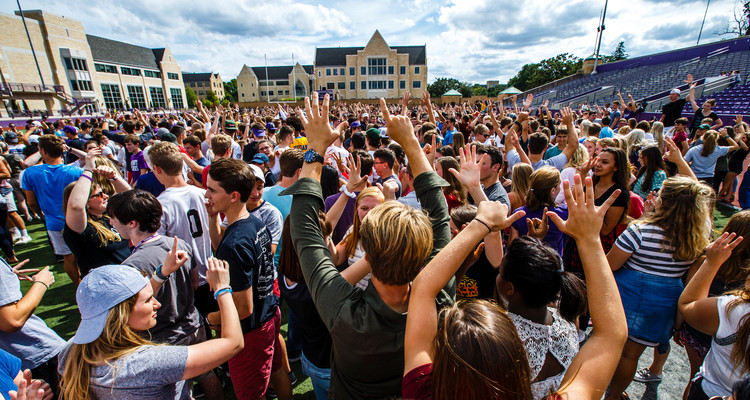
The freshman class has the highest academic credentials in the history of the University of St. Thomas, which posted a slight decrease in overall enrollment despite continuing growth in graduate engineering programs.
The 1,349 freshmen – out of a record 7,000 applications – represent the eighth-largest class ever and carry the best academic profile for average ACT score (27) and grade-point average (3.61), with 28 scoring a perfect 36 on portions of their ACT test. Thirty new Tommies were high school valedictorians, 16 were salutatorians, 204 never received a grade lower than A- and one third ranked in the top 10 percent of their class.
Overall enrollment is 9,983, down 262 students (2.6 percent) from a year ago and the first year since 1990 that enrollment has been under 10,000, according to statistics compiled by the Office of Institutional Effectiveness.
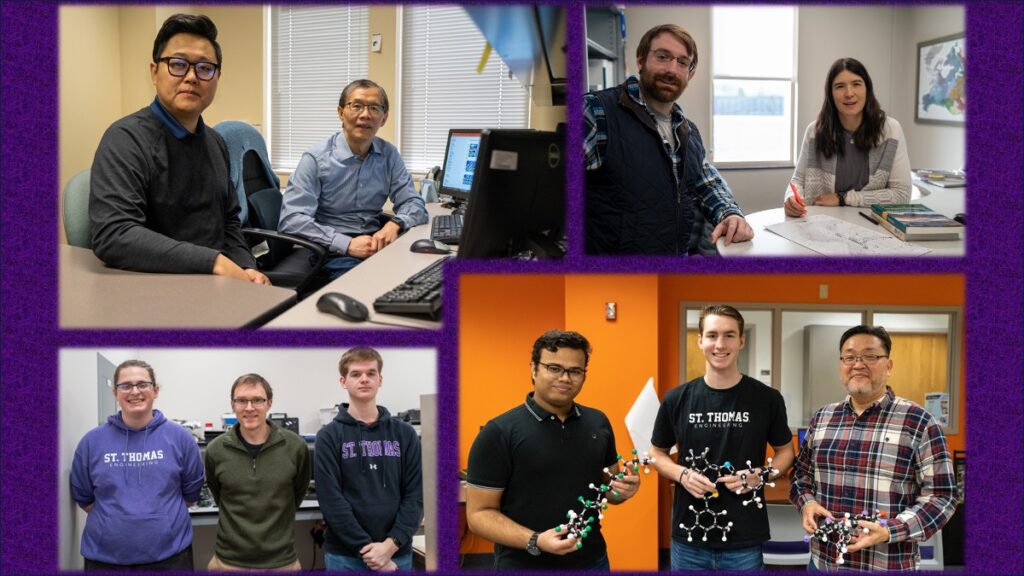
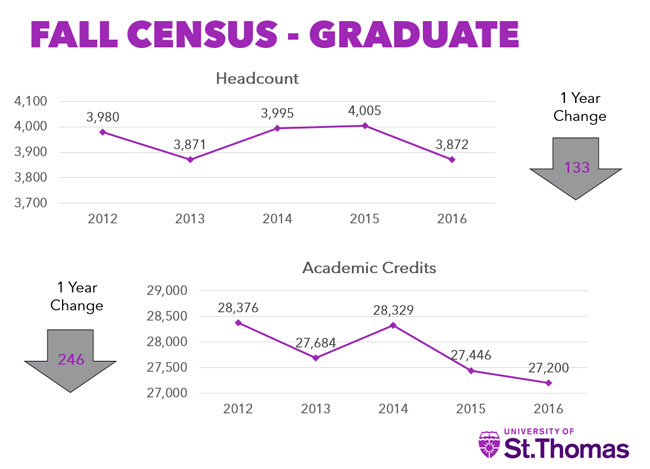
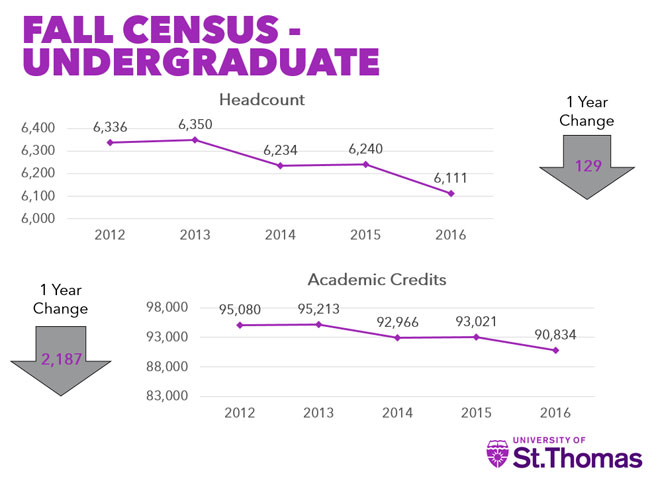
Undergraduate enrollment is 6,111 (down 129, or 2.1 percent). Enrollment at the graduate level is 3,872 (down 133 students, or 3.3 percent), with the School of Engineering increasing 16.4 percent to 895 students. In terms of enrollment, engineering now is the second-largest graduate program, behind the College of Education, Leadership and Counseling and slightly ahead of the Opus College of Business.
The total of undergraduate and graduate credit hours, which represents the number of courses that students are taking, is 118,033.5, a drop of 2 percent. At the undergraduate level, credit hours dropped 2.4 percent but at the graduate level, they dropped 0.9 percent.
Exactly like the last two years, undergraduates at St. Thomas comprise 61 percent of all students but account for 77 percent of credit hours. Overall, 71 percent are full-time students.
This year’s freshman class continues a string of large classes that have kept undergraduate enrollments above 6,000. Also helping is a healthy freshman-to-sophomore persistence rate. This year, 88.4 percent of last year’s freshmen have returned as sophomores.
The number of undergraduates who transferred to St. Thomas this fall is 203, down 23 from last year.
The students-of-color population has increased steadily over the years and this fall stands at 16.8 percent, up from 16.4 percent in 2015 and 15.5 percent in 2014. The percentages of students of color are:
- 13.3 for freshmen
- 14.9 for undergraduates
- 20.1 for graduate students
Here are the enrollment numbers for students of color:
- 408 Hispanic (296 undergrad and 112 graduate)
- 407 Black or African American (154 undergrad and 253 graduate)
- 452 Asian (224 undergrad and 228 graduate)
- 256 who list two or more races (189 undergrad and 67 graduate)
- 17 American Indian (6 undergrad and 11 graduate)
- 3 Hawaiian or other Pacific Islander (2 undergrad and 1 graduate)
The students-of-color numbers would be higher if international students were included. St. Thomas does not use the race of students from other countries when calculating the overall percentage of its students of color. This fall St. Thomas welcomed 545 new and returning international students (172 undergrads and 373 graduate students) from 65 countries. That’s an increase of 9 students from last year.
By number of international students, the top countries are: Saudi Arabia (124), China (111), India (95), Nepal (28) and Uganda (14). The top fields for the undergraduate international students are mechanical engineering, electrical engineering, financial management, communication and journalism, and operations management. The top fields for the graduate-level international students are data science, software engineering, information technology, business administration and law.
At a time when some colleges and universities are enrolling more women than men, the St. Thomas female-male ratio continues to show a near-even split. The percentage of students who are women is:
- 49.1 overall
- 45.9 for undergraduates
- 48 for new freshmen
- 54.2 for graduate students
Some 333 freshmen have a parent or grandparent who graduated from St. Thomas and 114 have a sibling who graduated or attends St. Thomas.
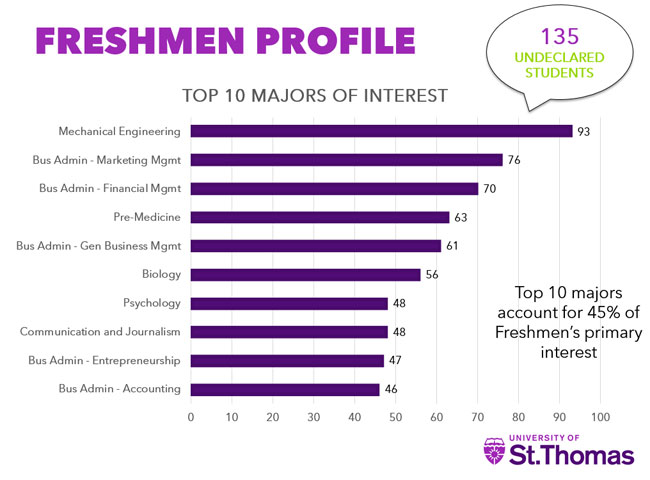
The top “majors of interest” indicated by the entering class are mechanical engineering; the business administration majors in marketing, financial management, general business management, entrepreneurship and accounting; pre-medicine; biology; psychology; and communication and journalism.
The percentage of St. Thomas students who indicated they are Roman Catholic has been on a gradual decline. Overall, 38.1 percent are Catholic, down from 40.7 last year. At the undergraduate level it is 44.5 percent and at the graduate level it is 28.0 percent. Overall, 71 percent of the students report some religious affiliation.
There are 205 undergraduate and graduate seminarians here this fall, down 13 from last year. Enrollment at the undergraduate-level St. John Vianney Seminary is 120, which is down 14 and includes 15 men studying in Rome. The graduate-level St. Paul Seminary School of Divinity has 85 men studying for the priesthood, up one from a year ago.
Enrollment on the St. Paul campus is 7,488, an increase of 24 from last year. St. Thomas is limited to 8,750 students on its main campus under a Conditional Use Permit approved by the St. Paul City Council in 2004. The highest enrollment in St. Paul was 8,712 in 1991, the year before the university opened its Minneapolis campus.
For undergraduates, commuter students this fall outnumber resident students 3,654 to 2,440. A year ago, there were 3,677 undergraduate commuters and 2,530 residents.
Three of the university’s seven colleges and schools lost enrollment and four gained. The largest of them, the College of Education, Leadership and Counseling, showed a 15.2 percent decline while the second largest, the School of Engineering, showed a 16.4 percent gain this year and that’s on top of an 18.7 percent gain a year ago.
Here’s the graduate-level enrollment and credit hours, and the percent change from last year, for St. Thomas’ colleges and schools:
| Program | Enrollment | % Change from 2015 | Credit hours | % Change from 2015 |
| College of Arts and Sciences | 127 | +4.1 | 508 | +1.2 |
| Opus College of Business | 893 | -10.1 | 5,613.5 | -8.9 |
| School of Divinity | 116 | -0.9 | 1,268 | 0.0 |
| College of Education, Leadership & Counseling | 1,048 | -15.2 | 5,967 | -9.0 |
| School of Engineering | 895 | +16.4 | 4,551 | +16.8 |
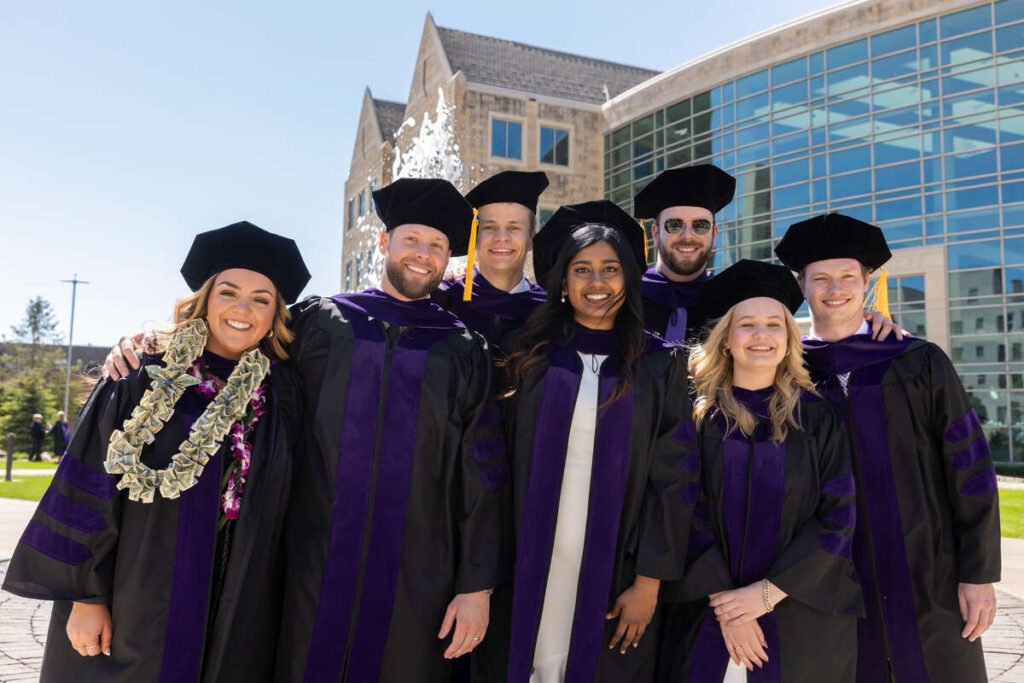
| School of Law | 407 | +5.7 | 5,648 | +4.7 |
| School of Social Work | 386 | +0.8 | 3,644 | -0.4 |
| Total | 3,872 | -3.3 | 27,199.5 | -0.9 |
From the Office of Institutional Effectiveness.
From the Office of Institutional Effectiveness.
From the Office of Institutional Effectiveness.