The supply of homes available to buy in the 13-county Twin Cities region dropped to a 10-year low in December, according to a monthly analysis conducted by the Shenehon Center for Real Estate at the University of St. Thomas’ Opus College of Business.
Each month the center tracks the median price for three types of sales: nondistressed or traditional; foreclosures; and short sales (when a home is sold for less than the outstanding mortgage balance). In addition, it looks for trends in the market and creates a monthly composite index score by tracking nine data elements for those three types of sales.
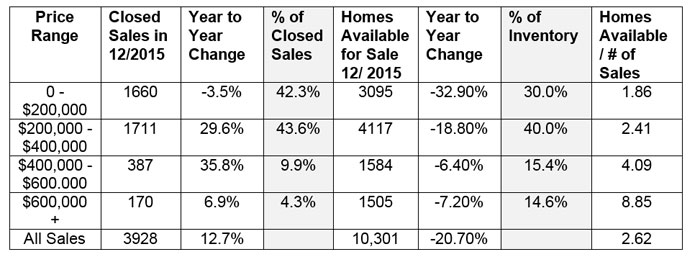
Herb Tousley, director of real estate programs at the university, said there has been a shortage of homes for sale all year, but in December that number dropped to the 10-year low of 10,301. The shortage is especially pronounced for the more moderately priced homes. For example, homes that cost less than $200,000 represented 30 percent of the homes on the market in 2015 but 42 percent of the sales. In that same category there were 1.86 homes available for each one sold. On the other end of the price range, there were 8.85 homes over $600,000 on the market last year for every one that sold.
“The bottom line is that there is way more demand than supply of homes that are priced at less than $400,000,” Tousley said. “The continuing shortage of homes for sale coupled with increased demand for houses in that price range will continue to keep an upward pressure on prices but will likely be a drag on the number of closed sales.
“This is great if you are a seller but is much more challenging if you are a buyer,” he said.
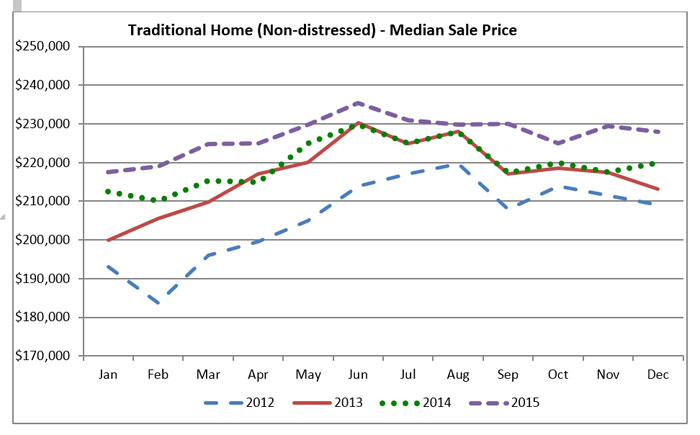
Except for the low inventory, December marked the end of a year that has been a continuation of the steady recovery that the Twin Cities housing market has enjoyed for the past three and a half years. The sale price of a nondistressed (traditional sale) home was up 3.7 percent for the year; the price of a short-sale home was up 19.7 percent; and the sale price of foreclosed homes was unchanged. The combined increase for all three categories was 10 percent.
Tousley expects the recovery to continue. “In the second half of 2016, increasing sale prices should start to bring out more sellers as homeowners’ equity positions begin to improve,” he said.
Multigenerational households – A rising trend?
According to John Burns Real Estate Consulting, 14 percent of U.S. households (that’s 16.5 million households) now live multigenerationally. The number is expected to increase for three reasons:
- Delaying marriage has increased the number of young adults who live with their parents.
- Surging retirement has increased the number of retirees living with their children.
- Significant immigration from countries where multigenerational living is the norm also has helped boost the numbers.
Tousley said that if the 14 percent number holds true for the Twin Cities, that would mean there are 189,381 multigenerational households in the 13-county region.
He noted that according to a Consumer Insights survey of more than 20,000 shoppers for a new home, 44 percent said they would like to accommodate their elderly parents in their next home. Also, another 42 percent plan on accommodating children who are 18 and older in their next home.
“Since most of the U.S. housing stock was not built for multigenerational living, this provides a tremendous opportunity for home builders,” Tousley said. “This trend is also increasing the number of secondary dwelling units, sometimes called in-law units.
“These units can be set aside within a larger single-family home, such as a separate basement or attic apartment; attached to a primary residence, such as an apartment above an attached garage; or smaller separate units built on the same lot as single-family homes.
“Over the next decade, look for these trends to change the makeup of the single-family housing stock in the Twin Cities.”
The St. Thomas indexes
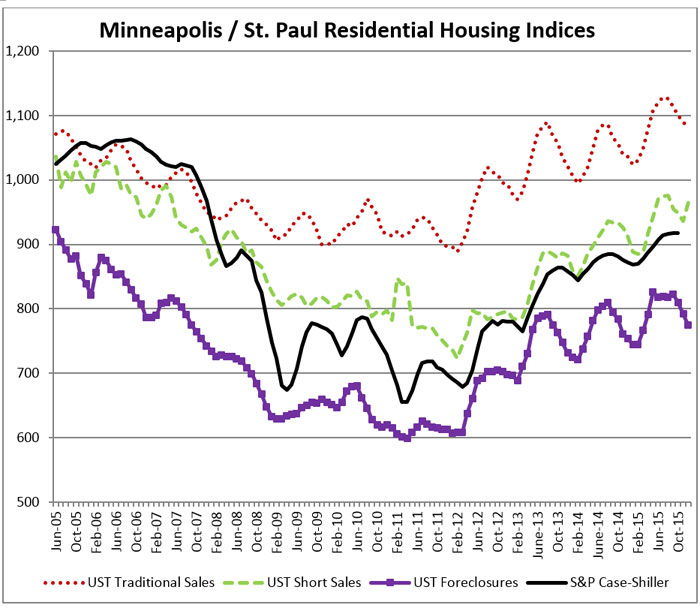
Here are the Shenehon Center’s monthly composite index scores for December 2015. The index, which tracks nine data elements for the three types of sales (traditional, short sales and foreclosures), started in January 2005. For that month, the center gave each of the three indexes a value of 1,000.
The December 2015 index score for traditional sales was 1,082, down .8 percent from November but up 5.2 percent for the year.
The December 2015 index score for short sales was 965, up 3.1 percent from November and up 6.4 percent for the year.
The December 2015 index score for foreclosures was 774, down 2.3 percent from November and up 3.3 percent for the year.
More information online
The Shenehon Center’s charts and report for December can be found on the center’s website.
The index is available free via email from Tousley at hwtousley1@stthomas.edu.