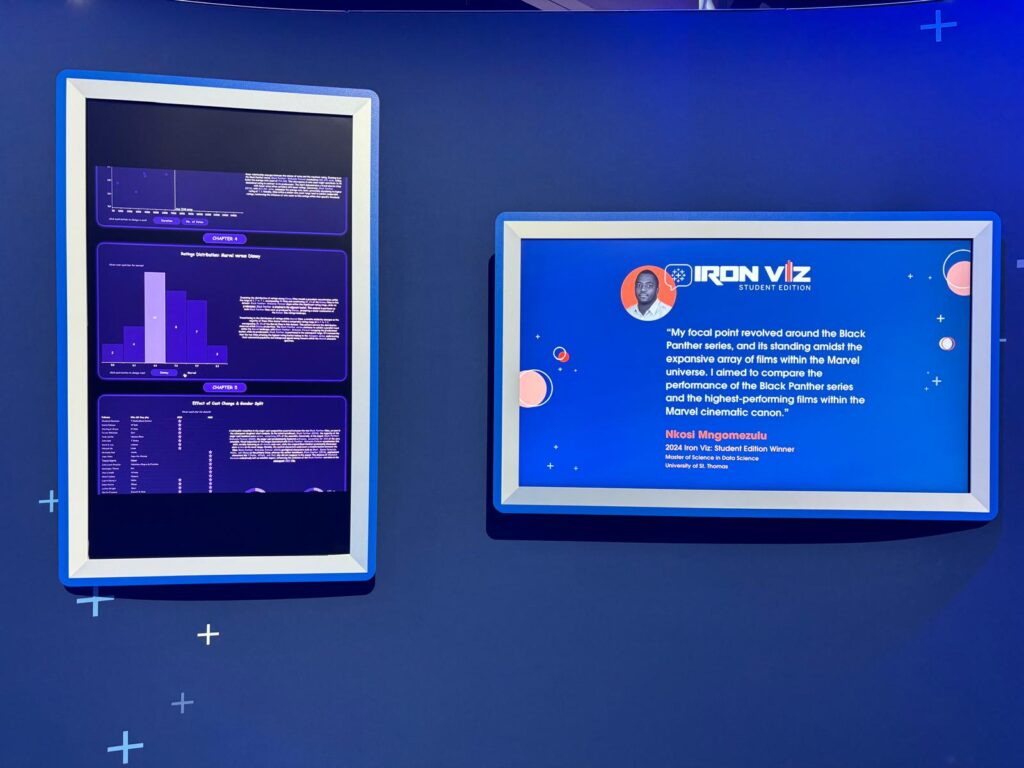
University of St. Thomas School of Engineering graduate student Nkosi B. Mngomezulu, from Ezulwini in the Kingdom of Eswatini, recently was named one of three winners in the Iron Viz: Student Edition competition.
Iron Viz: Student Edition is a global competition that was founded in 2019 by Tableau, a Salesforce company, to showcase student data visualizations skills across the world. As a winner, Nkosi received an all-expenses paid trip to San Diego to present his winning visualization in April at the Tableau Conference 2024.

“Being named a winner of the Tableau Student Iron Viz competition is an immense honor and a source of great pride,” Mngomezulu said. “It represents not only a personal achievement but also a validation of the dedication and effort invested in honing my data visualization skills. The recognition from such a prestigious competition reinforces my commitment to excellence in the field of data analytics. I am grateful for the opportunity to showcase my abilities and am inspired to further contribute to the data visualization community, leveraging this achievement as a steppingstone for continued professional growth.”
Each year, the competition has a theme, and 2024’s was Data + Movies. Students were to visualize their favorite movies and cast using access to an IMDB database. This year, 66 participants from more than eight countries participated in the competition.
The judging panel was composed of members from Tableau’s community of users: Tableau Ambassadors, Visionaries, and former Iron Viz winners. The judges used the following scoring criteria:
- Beauty and design: How appropriate was the design for the story being told?
- Storytelling: Is a clear story being told or a question being explored, and is there appropriate context?
- Analytical depth: How sophisticated and appropriate is the data that is being used for the story?
- Visualization best practices: Are insights being portrayed using appropriate layout, charts and interactivity features?
Courtney Totten, Tableau’s director of data skills and academic programs, congratulated Mngomezulu on the great achievement.
“He created a captivating data story on ‘Black Panther’ and his participation in our student competition enhances Tableau’s data community. His commitment and skills in data visualization are in-demand assets for any career, especially for data professionals.”
See Mngomezulu’s visualization here.