How much is my home worth? Twin Cities homeowners asking that question might find some encouraging news in a new residential real estate index that for the first time separates traditional, normal home sales from foreclosure and other distressed sales.
The Shenehon Center for Real Estate at the University of St. Thomas’ Opus College of Business today released its first Minneapolis St. Paul Residential Real Estate Index. The monthly index uses nine data elements to measure the strength and health of the residential housing market in the 13-county metro market.
The St. Thomas index was developed to provide a more detailed analysis of the Twin Cities residential real estate market than is available from the Standard and Poor’s Case-Shiller Home Price Index.

Herb Tousley
The widely used Case-Shiller index uses data from repeat sales of single-family homes. It does not distinguish, however between a traditional, normal market sale and a distressed sale. Traditional sales are those unaffected by foreclosure or the threat of foreclosure.
“The St. Thomas index is the first of its kind that we are aware of,” said Herb Tousley, director of real estate programs at St. Thomas. “In recent years we knew that the price had dropped for traditional, undistressed home sales, but we also felt that traditional-sale prices had not dropped as sharply as the Case-Shiller Index would seem to indicate.
“We decided to create a more detailed index that differentiates between traditional sales and distressed sales. It also accounts for the proportion of distressed sales in the Twin Cities area.”
St. Thomas’ monthly real estate report contains four composite index scores. In addition to an overall index based on all home sales in the Twin Cities, there are separate scores for traditional sales, foreclosure sales and short sales.
St. Thomas’ first report shows that if you own a home or are selling a home that is not distressed, the value has not been impacted as much as less-detailed market data might indicate.
While the selling price of a home is a key component of the St. Thomas index, other factors contribute to the composite score: the number of closed sales, the proportion of distressed to traditional sales, days on the market, month’s supply, number of pending sales, number of new listings, number of homes for sale, and the sale price as a percentage of the asking price.
To allow month-to-month comparisons of residential real estate trends in the Twin Cities, St. Thomas assigned the baseline value of 1,000 to January 2005, a month that was near the apex of the residential housing bubble.
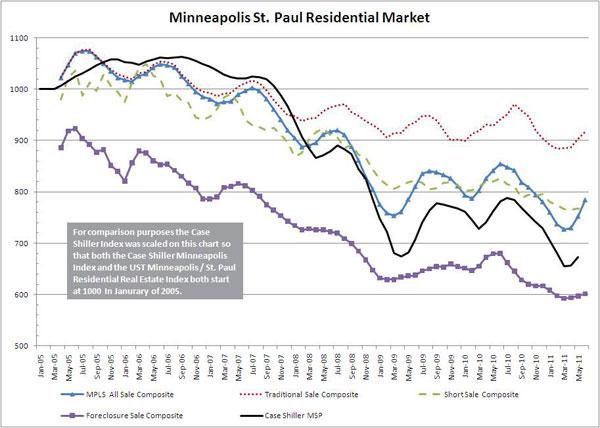
A chart showing monthly changes since January 2005 can be found on the Shenehon Center for Real Estate website. To subscribe to a free, monthly index, email Tousley.
St. Thomas’ chart for the 13-county Twin Cities area shows that since 2005:
- The composite score of all sales hovered above and below the 1,000 baseline until the spring of 2007 when it began a sustained downward trend that hit bottom in March 2011 with a score of 727. It since has rebounded slightly to 784 in June 2011.
- The score for traditional, undistressed sales fell much less and generally has remained in the 900 range. The most recent score was 917.
- The score for distressed sales was considerably lower than all other scores. That index started in the 900 range and has fallen to 602.
- The score for “short sales” generally mirrored the path of the composite score for all home sales and mostly recently was 766.
- For comparison purposes, the Case-Shiller index was scaled and plotted on the St. Thomas chart. On the university’s chart, Case-Shiller remained in the 1,000 range until the fall of 2007 when it began a sharp downward trend. Today it stands at 671, compared to St. Thomas’ score of 917 for undistressed sales and 602 for foreclosure sales.
“Reports that do not separate distressed and traditional sales have data that skews downward wherever a disproportionately large number of sales in a given time are distressed property sales,” Tousley said.

Dr. Thomas Hamilton
“It varied from month to month, but between 35 percent and 60 percent of all transactions recorded in the last few years were recorded as distressed. This equates to seven to 12 times the normal number of distressed sales, and this disproportionality is what drove other indexes to exhibit low values.”
Tousley noted that St. Thomas’ all-sale composite index moved up 3 percent between April and May, and 4.25 percent between May and June. He attributed much of the increase to a drop in distressed sales from 45 percent down to 38 percent.“ Although this is a good sign, it will take several months of positive growth to be considered a trend. Summer is normally a time when the number of traditional sales increases and prices tend to be higher. If this holds true for the rest of the summer and the percentage of distressed sales continues to decrease, we are cautiously optimistic about seeing improvement in our composite index in the coming months,” he said.
Research for the St. Thomas index was conducted by Tousley and Dr. Thomas Hamilton, associate professor of real estate at the university.
Tousley said each monthly St. Thomas index for the Twin Cities will take about two weeks to calculate. The residential sales data for July, for example, will be analyzed and released by mid-August. That’s about a month sooner than the Case-Shiller data is available.


