It has taken a full decade, but the median sale price of a home in the Twin Cities in May 2016 almost reached the all-time record high set back in the housing-bubble days of 2006, according to a monthly analysis conducted by the Shenehon Center for Real Estate at the University of St. Thomas’ Opus College of Business.
Fueled by low supply and brisk demand, the median sale price of a home in the 13-county Twin Cities region reached $237,000 in May. That’s just shy of the highest median price on record, which was $238,000 back in June 2006. While the selling prices are similar, there are many differences in the 2016 market when compared to 2006.
Each month the St. Thomas center tracks the median price for three types of sales: nondistressed or traditional; foreclosures; and short sales (when a home is sold for less than the outstanding mortgage balance). In addition, it looks for trends in the market and creates a monthly composite index score by tracking nine data elements for those three types of sales.
Herb Tousley, director of real estate programs at the university, observed that the supply of homes on the market dropped to its current low level in early 2013 and has remained historically low since then. He said possible reasons include difficulty in finding and purchasing a replacement home at a reasonable price; higher standards to qualify for a new mortgage; lackluster wage growth over the last several years; and homebuilders not building as many single-family homes as they used to.
Meanwhile, on the demand side, Tousley said low interest rates, an improving economy, and a tight rental market are key reasons why the number of sales has steadily been increasing to near pre-recession levels.
“In spite of all of the new apartments that have been built over the last few years we remain in a very tight rental market,” he said. “The area has been absorbing the new rental units, and vacancies continue to remain historically very low. The result of a low vacancy and a tight rental market is high rent growth. In 2015 the average rent in the Twin Cities increased by 5 percent. Repeated large rent increases over the last several years have many renters considering the idea of homeownership as an alternative, creating additional potential homebuyers.”
Comparing 2016 to 2006
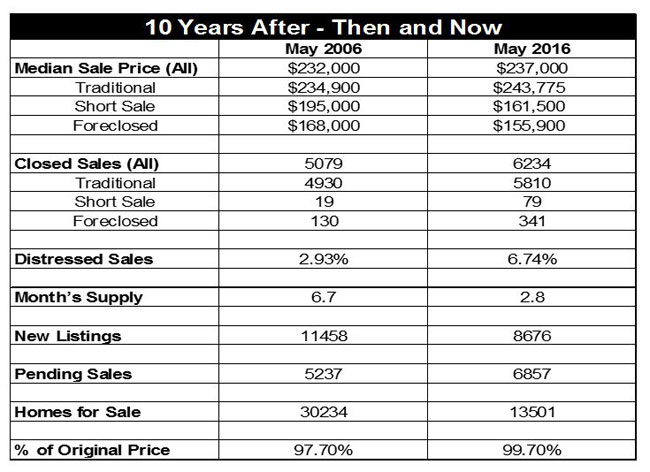
The Shenehon Center for Real Estate compared May 2016 housing-market statistics with those of 2006. While the selling prices are very similar, some characteristics are quite different. A few examples: in May 2006 there were 5,079 closed sales and in May 2016 there were 6,234; in May 2006 there was a 6.7-month supply of homes for sale and in May 2016 there was a 2.8-month supply; in May 2006 there were 11,458 new listings and in May 2016 there were 8,676; and in May 2006 there were 30,235 homes for sale and in May 2016 there were 13,501.
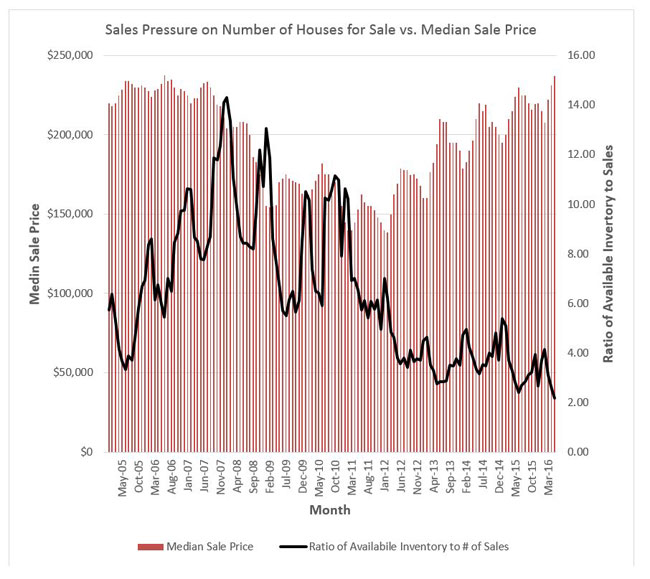
 Another way of looking at the impact of low inventory on sale prices is to create a ratio for the number of homes available for sale divided by the number of homes sold that month. For example, if the ratio was 5, it means there were 5 homes available on the market for each buyer. A lower number indicates a tighter market. There were months back in 2007 to 2010 when the ratio was 10 to 14; it has dropped significantly.
Tousley said that for most of the previous 14 months the ratio in the Twin Cities market has been less than 4, and in May 2016 the ratio hit an all-time low of 2.17. “When the ratio gets lower and the market gets tighter, the median sale price increases,” he said.
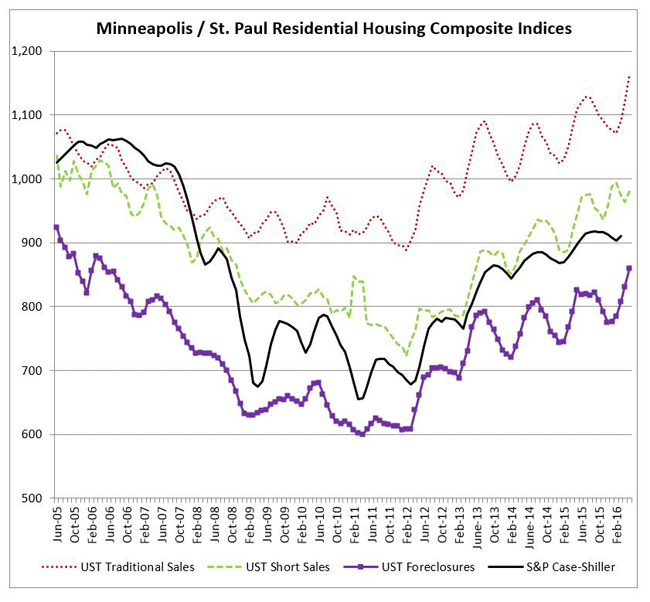
Here are the Shenehon Center’s monthly composite index scores for May 2016. The index, which tracks nine data elements for the three types of sales (traditional, short sales and foreclosures), started in January 2005. For that month, the center gave each of the three indexes a value of 1,000.
The May 2016 index score for traditional sales was 1,163, up 3.7 percent from April 2016 and up 8.6 percent from May 2015.
The May 2016 index score for short sales was 980, up 1.6 percent from April 2016 and up 7.7 percent from May 2015.
The May 2016 index score for foreclosures was 859, up 3.2 percent from April 2016 and up 9.4 percent from May 2015.
The May 2016 score was the highest ever for the traditional sale index. “It is the result of a very tight supply situation and continuing high sales activity, indicating the continued health and resurgence of the Twin Cities housing market,” Tousley said.
There are far fewer distressed sales now than there were during the height of the Great Recession. In May, the 79 short sales represented 1.3 percent of total sales and the 341 foreclosure sales represented 5.5 percent of total sales.
“As the number of distressed sales continue to return to pre-crash levels, the foreclosure index will continue to diminish in importance,” Tousley said.
The Shenehon Center’s complete online report for May can be found on its website here.
The report is available free via email from Tousley at hwtousley1@stthomas.edu.


