The Shenehon Center for Real Estate examines why the Twin Cities continues to have so few homes on the market.
Home prices in the Twin Cities real estate market continue to run above last year, but the inventory of homes for sale is still quite low, according to the Residential Real Estate Price Report Index, a monthly analysis of the 13-county metro area prepared by the Shenehon Center for Real Estate at the University of St. Thomas’ Opus College of Business.
Each month the Shenehon Center tracks nine housing-market data elements, including the median price for three types of sales: nondistressed or traditional-type sales, foreclosures, and short sales (when a home is sold for less than the outstanding mortgage balance).
“Improving market health”
In his analysis for the month of October, Herb Tousley, director of real estate programs at the university, said that “from September to October, most of the market indicators for the Twin Cities housing market continue to exhibit the normal seasonal pattern that we expect to see in the fall.”
In October, median sale prices and pending sales were essentially unchanged, and the number of closed sales and new listings were down slightly from September.
Compared to a year ago, the numbers show a healthy increase, he said, adding that the number of foreclosures and short sales, at 22 percent of all sales, remain well below last year. Tousley characterized that as “a continued indicator of improving market health.”
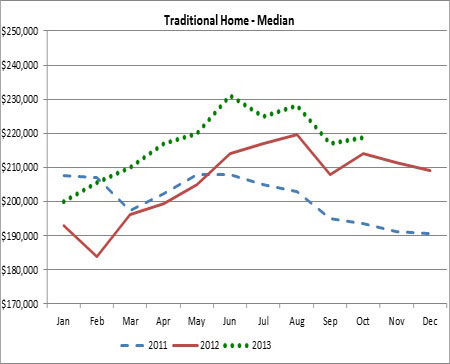
The green dots trace this year's median prices for traditional homes (those not in foreclosure or short sales).
The median price of a nondistressed home (not a foreclosure or short sale) in October was $218,750. That’s up from September’s $217,000 and up 2 percent from $214,350 in October 2012. Tousley feels the annual rate of increase in the price of traditional homes will moderate from the double-digit gains seen earlier this year and will remain in the 3 percent to 5 percent range through the first quarter of 2014.
Meanwhile, he feels the percentage of distressed sales will continue to decline in the first quarter of 2014 as the number of newly foreclosed properties declines and the number of nondistressed homes on the market begins to increase.
Why so few homes on the market
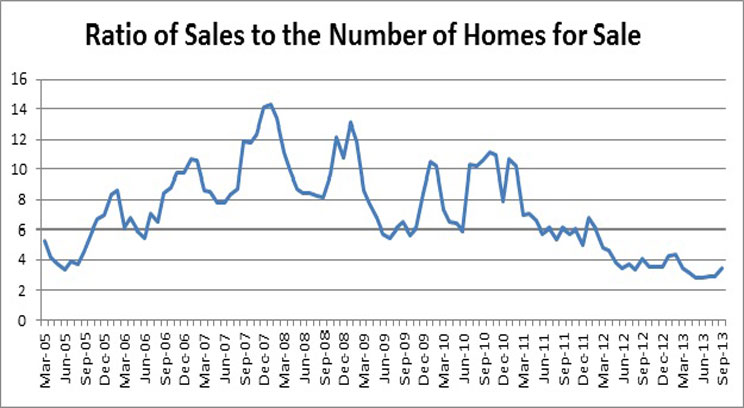
The number of homes available for sale has been at historically low levels for months. A chart on the Shenehon Center’s website shows that back in November 2007 there were as many as 14 homes for sale for every one sold. The number was still over 10 in November 2010, but it has been going downhill since.
In October 2013 there were 15,669 homes for sale in the Twin Cities area. That represents just 3.6 homes on the market for every one sold.
The low ratio contributes to a seller’s market, Tousley said, and the unmet demand creates upward pressure on home prices.
“One of the reasons the inventory of homes for sale remains persistently low is there is still a historically high number of homeowners who have negative equity or effective negative equity,” he said.
Negative equity means that a homeowner owes more on his or her mortgage than the home can be sold for at today’s market prices. Homeowners in that situation are not in a position to put their homes on the market.
“Effective negative equity” is when the loan-to-value ratio is more than 80 percent, which makes it more difficult for the homeowner to come up with a down payment needed for the purchase of the next home.
An example of this is someone who owns a home that could be sold for $200,000, and owes $190,000 on the mortgage. “In this case, the homeowner is not underwater, but the $10,000 that would be left after the sale might not be enough for a down payment on a larger home. As a result, they do not put their homes on the market, either,” Tousley said.
He predicts that as long as interest rates remain steady, “these conditions indicate that the supply of homes will continue to be tight through fall and winter into early spring.”
The Twin Cities is fairly close to the United States as a whole when it comes to both “negative” and “effective negative” rates. In the United States, 21 percent of owner-occupied homes have a mortgage in negative equity (or underwater); in the Twin Cities, it’s 21.1 percent.
For mortgages in the “effective negative equity” category, it’s 39.2 percent nationally and 41.5 percent in the Twin Cities.
And for homes with “negative-equity” mortgages, the Shenehon Center reported how far those mortgages are underwater. For the United States, it is 41.8 percent. The Twin Cities is doing somewhat better, at 35.3 percent.
New home construction
The pace of permits for new-home construction, while slowing a bit, still remains well ahead of last year. For most of 2013, permits in the Twin Cities area were running about 30 percent ahead of 2012; in October it decreased to about 26 percent ahead of last year.
Through the end of October 2013, the Twin Cities saw about 4,300 permits for new homes; that compares to 3,374 permits in October 2012.
The St. Thomas Indexes
The St. Thomas Traditional Sale Composite Index, the one that tracks nine data elements, stands at 1057 for October. It took a 13-point seasonal downturn from September but is 4.8 percent above October of 2012.
Composite indexes for the distressed sales also are improving over last year. The foreclosure index for October 2013 of 764 is up 8.7 percent from October 2012. The short sale index for October 2013 of 878 is up 10.9 percent from October 2012.
More information online
The Shenehon Center’s report for October can be found on its website.
Research for the monthly reports is conducted by Tousley and Dr. Thomas Hamilton, associate professor of real estate at the university. The index is available free via email from Tousley at hwtousley1@stthomas.edu.
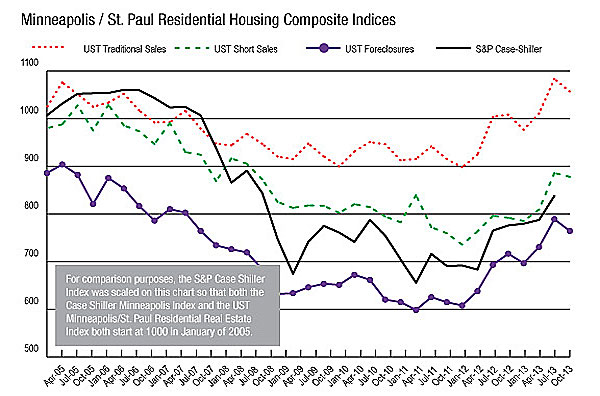
The St. Thomas index uses nine data elements to trace the health of the Twin Cities housing market going back to 2005.