More and more single-family rental homes – a trend that has been developing locally and nationally since the start of the Great Recession in 2008 – means fewer and fewer single-family homes are available for purchase.
According to the most recent market analysis by the Shenehon Center for Real Estate at the University of St. Thomas’ Opus College of Business, this increased percentage of rental homes is yet another factor contributing to a historically low supply of homes for sale in the 13-county Twin Cities region.
In earlier reports, the center examined other causes that contribute to the shortage: low or negative equity during the recession, concerns about job or financial situations, and a trend of keeping homes longer than in the past. Earlier this year, the center predicted that the persistent low availability of homes for sale, coupled with strong demand, will result in a 5 percent increase in the median sale price of Twin Cities homes this year.
“On a national and local basis we have seen the formation of companies and funds such as Blackstone’s Invitation Partners and American Homes 4 Rent that are buying large numbers of single-family homes for investment purposes,” said Herb Tousley, director of real estate programs at the university.
“Blackstone is the largest of single-family investors; they currently own about 50,000 homes across the country,” he said. “Their strategy was to purchase single-family homes at deeply discounted prices during the recession, rehab the property and then hold the property long term as a rental property. Even though home values have increased since the end of the recession, many of these companies are still actively buying.
“Institutional investors have largely figured out how to maintain and efficiently operate ‘scattered-site single family rentals’ on a professional basis. Most of these homes are in established neighborhoods. Renovation and a regular maintenance schedule preserves the housing stock and maintains the quality of the surrounding neighborhood,” Tousley said.
This is a trend that is not only occurring in the core cities of Minneapolis and St. Paul: It is happening all across the Twin Cities metro area. The total number of single-family homes being rented in suburban neighborhoods has increased from 12,000 in 2000 to over 28,000 in recent years, according to data compiled by the Metropolitan Council. Of the 93 cities that were tracked, all but 32 saw their single-family rentals grow by at least 100 percent between 2000 and 2013.
Below are the top five cities around the Twin Cities by percentage of single-family rentals.
| City | Single-family Homes as Rentals in 2000 | % of Rentals in 2000 | Single-family Homes as Rentals in 2013 | % of Rentals in 2013 |
| Minneapolis | 5,864 | 8% | 10,278 | 14% |
| St. Paul | 3,976 | 7% | 7,416 | 13% |
| Brooklyn Center | 193 | 3% | 867 | 12% |
| Columbia Heights | 153 | 3% | 610 | 12% |
| Anoka | 177 | 5% | 449 | 11% |
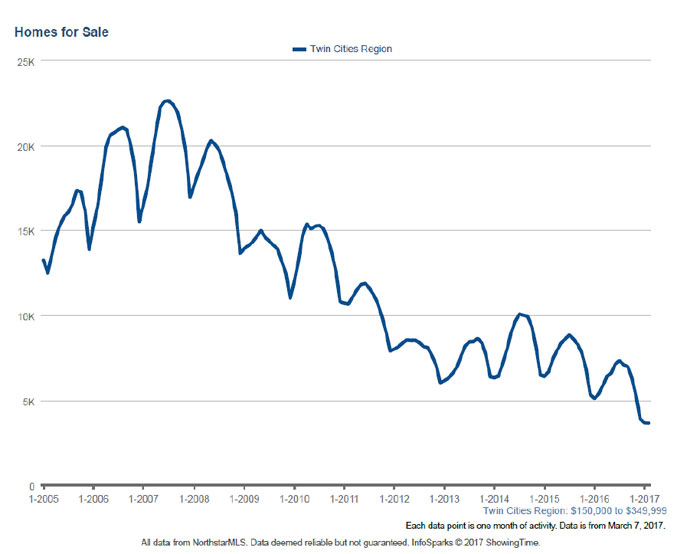
Meanwhile, the number of homes available for sale that are priced between $150,000 and $350,000 has been steadily declining since 2008.
Tousley said that homes in this price range are very attractive to the large institutional investors because they make good rental properties that provide a good return to their investors. However, homes in that same price range also are the most attractive to first-time homebuyers and first-move-up buyers.
“The homes that are purchased by the institutional investors are going to be held long term as rental properties so they in effect would be ‘off the market’ and will not be available for sale for a long period of time. The institutional ownership of large numbers of homes as single-family rentals is a relatively new development in the housing market and it is one more factor that is contributing to the chronically low number of homes available for sale,” he said.
February market summary
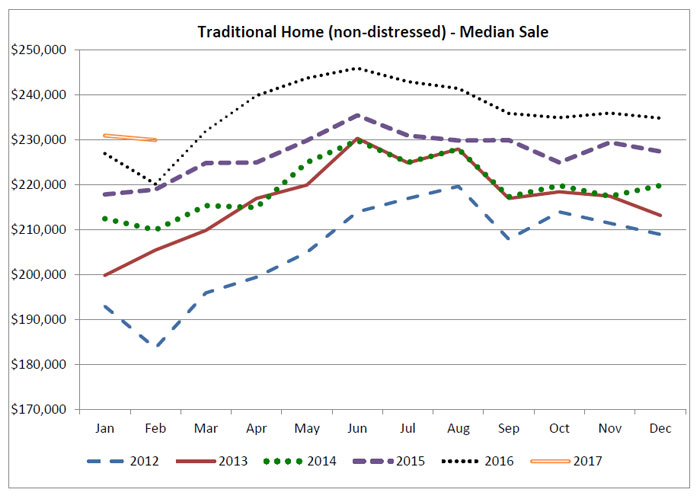
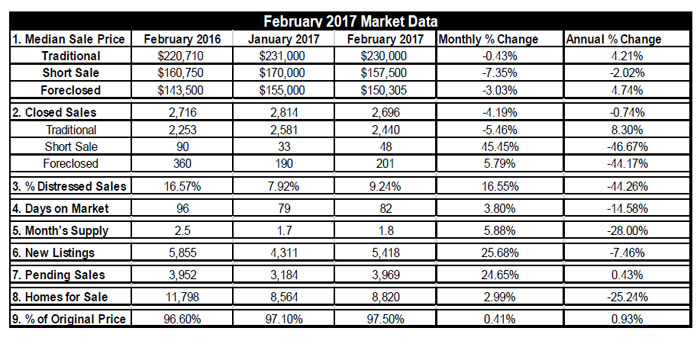
The housing market in the Twin Cities continued on its normal seasonal pattern in February. As expected the overall median sale price was essentially the same as January at $223,000. The traditional, nondistressed median sale price was $230,000, a 4.2 percent increase compared to February 2016.
The number of homes sold in February was 2,696 compared to 2,814 in January and 2,716 in February 2016. The percentage of distressed sales (foreclosures and short sales) ticked up slightly in February at 9.2 percent, however that percentage should continue to decline to pre-recession levels as we move into the spring selling season.
As noted earlier, the continued shortage of homes available for sale continues to be an issue. As buyers become more active in the spring-summer selling season, the shortage will create additional upward pressure on sale prices.
“The concern is that if this continues over a long period of time … where median sale prices are increasing faster than wages and income … it will begin to create affordability issues especially if interest rates begin to rise,” Tousley said.
The St. Thomas indexes
Here are the Shenehon Center’s monthly composite index scores for February 2017. The index, which tracks nine data elements for the three types of sales (traditional, short sales and foreclosures), started in January 2005. For that month, the center gave each of the three indexes a value of 1,000.
- The February 2017 index score for traditional sales was 1,114, down .4 percent from January 2017 and up 4.1 percent from February 2016.
- The February 2017 index score for short sales was 993, down 2.5 percent from January 2017 and up .1 percent from February 2016.
- The February 2017 index score for foreclosures was 842, up .2 percent from January 2017 and up 7.5 percent from February 2016.
More information online
The Shenehon Center’s complete online report for February can be found on its website.
The report is available via email from Tousley at hwtousley1@stthomas.edu.