For the second year running, overall enrollment at the University of St. Thomas increased very slightly, reversing six years of very slight declines. Enrollment this fall is 10,245; that’s up 16 students or 0.16 percent from last year. The university’s enrollment has been above 10,000 for the past 24 years, with a peak of 11,570 in 2001.
Some highlights, according to statistics compiled by the St. Thomas Office of Institutional Effectiveness:
- Another large freshman class, along with one of the best freshman-to-sophomore persistence rates ever, are keeping undergraduate enrollment numbers strong.
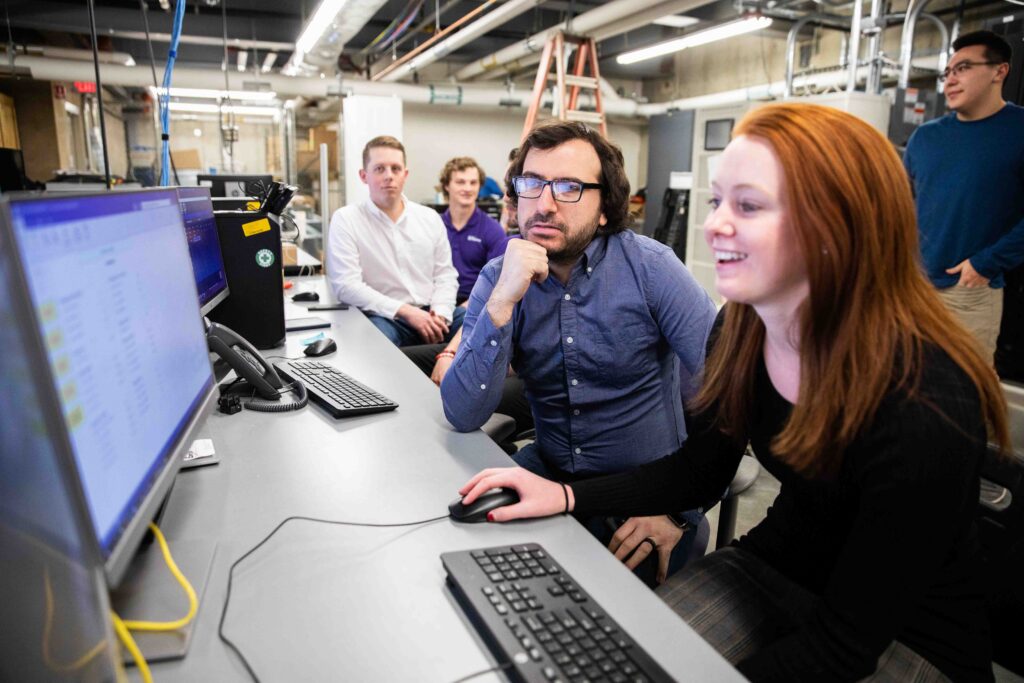
- While most graduate-level programs showed slight decreases, the School of Engineering posted some strong gains.
- And St. Thomas has more students of color than ever.
Undergraduate enrollment is 6,240; that’s up 0.1 percent or 6 students.
Graduate enrollment is 4,005; that’s up 0.25 percent or 10 students
The total of undergraduate and graduate credit hours, which represent the number of courses that students are taking, is 120,466.5, a drop of .7 percent. Exactly like last year, undergraduates at St. Thomas comprise 61 percent of all students but account for 77 percent of credit hours. Overall, 70 percent are full-time students and 30 percent are part-time.
This year’s freshman class of 1,421 is third-largest on record. The largest, by a big margin, was the giant 2010 class of 1,519, and the second largest was 1,447 in 2012. The large classes the university has recruited in recent years are keeping undergraduate enrollments well above 6,000. Also helping is a healthy freshman-to-sophomore persistence rate. This year, 88.9 percent of last year’s freshmen have returned as sophomores. That nearly ties the highest persistence rate on record, which was 89 percent in 2004.
The number of undergraduates who transferred to St. Thomas this fall is 226, down 26 from last year.
The students-of-color population has increased steadily over the years and this fall stands at 16.4 percent, up from 15.5 percent in 2014 and 14.8 percent in 2013. The percentages of students of color are:
- 14.7 for freshmen, the highest ever for the freshman class and up from 12.1 a year ago
- 15 for undergraduates, up from last year’s 14.4
- 18.8 for graduate students, up from last year’s 17.4
These percentages would be higher if international students were included. St. Thomas does not use the race of students from other countries when calculating the overall percentage of its students of color. This fall St. Thomas welcomed 536 international students (198 undergrads and 338 graduate students) from 63 countries.
The number of international students is up 47 from last year, is up 183 from five years ago, and is the highest since 2001. St. Thomas has the fifth-highest number of international students among Minnesota’s higher education institutions.
By number of international students, the top countries are: Saudi Arabia, China, India, Uganda and Nepal.
Here are the enrollment numbers for students of color:
- 434 Hispanic (320 undergrad and 114 graduate)
- 408 Black or African American (153 undergrad and 255 graduate)
- 406 Asian (211 undergrad and 195 graduate)
- 283 who list two or more races (197 undergrad and 86 graduate)
- 20 American Indian (10 undergrad and 10 graduate)
- 2 Hawaiian or other Pacific Islander (both graduate)
At a time when some colleges and universities are enrolling more women than men, the St. Thomas female-male ratio continues to show a near-even split. The percentage of students who are women is:
- 49.2 overall
- 45.6 for undergraduates
- 50 for new freshmen
- 54.9 for graduate students
Not only is St. Thomas enrolling larger freshman classes in recent years, students are arriving with strong academic profiles. Thirty-two new Tommies were valedictorians of their high school classes. Some other characteristics:
- Their average ACT score was 26.2 (a tenth of a percent behind last year’s record 26.3)
- Their average grade-point average was 3.58 (also right behind last year’s record 3.59)
- 197 never received a grade lower than A- throughout high school
- A third ranked in the top 10 percent of their high school class
- 41 scored a perfect 36 on portions of their ACT test. One student scored a 36 on all portions
- 304 had a parent or grandparent who graduated from St. Thomas
The percentage of St. Thomas students who indicated they are Roman Catholic did not change much this year. Overall, 40.7 percent are Catholic; at the undergraduate level is it 47.6 percent and at the graduate level it is 30.0 percent. Overall, 73.7 percent of the students report some religious affiliation, a percentage that has remained fairly constant over the past five years.
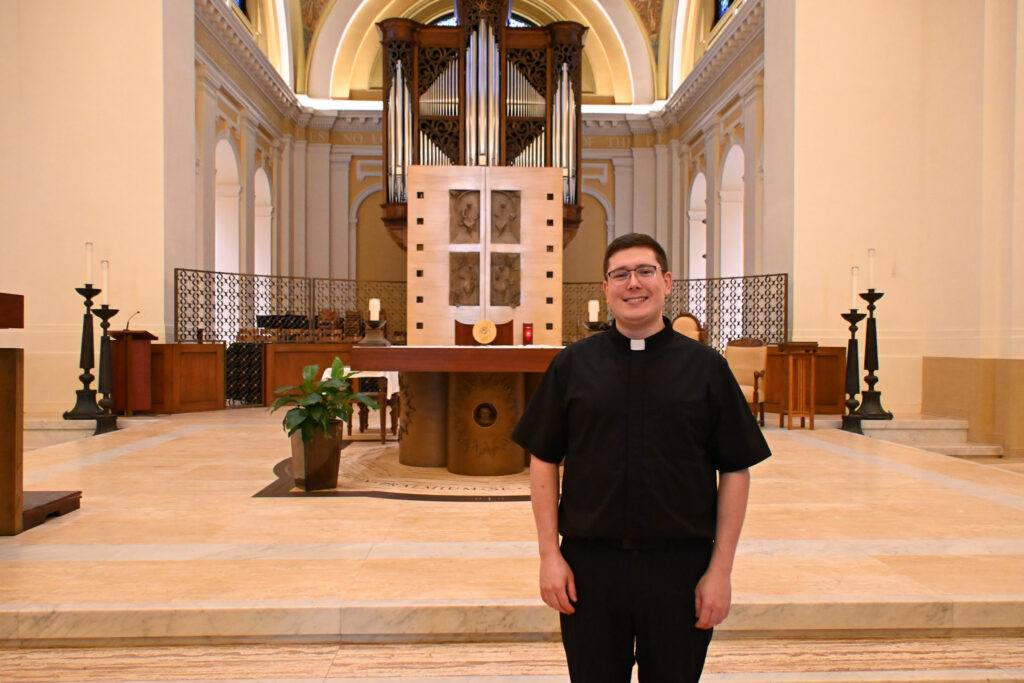
There are 218 undergraduate and graduate seminarians here this fall, down 15 students or 6.4 percent. Enrollment at the undergraduate-level St. John Vianney Seminary is 134, which is down three from last year and includes 17 men studying in Rome this semester. The graduate-level St. Paul Seminary School of Divinity has 84 men studying for the priesthood, down 12 from a year ago.
Enrollment on the St. Paul campus is 7,464, an increase of exactly one person from last year. St. Thomas is limited to 8,750 students on its main campus under a Conditional Use Permit approved by the St. Paul City Council in 2004. The highest enrollment in St. Paul was 8,712 in 1991, the year before the university opened its Minneapolis campus.
For undergraduates, commuter students this fall outnumber resident students 3,677 to 2,530. A year ago, there were 3,669 undergraduate commuters and 2,536 residents.
Broadly speaking, if you combine graduate and undergraduate enrollment numbers as well as similar majors or fields of study, the 10 most-popular areas of study at St. Thomas are business and management, education, engineering and software, biology, social work, law, seminary and religion-related, psychology, communication and journalism, and health and human performance.
The College of Education, Leadership and Counseling again this year has St. Thomas’ largest graduate enrollment. While most of St. Thomas’ seven colleges and schools posted slight declines in graduate enrollment and credit hours, the third-largest division, the School of Engineering, tallied an 18.7 percent increase in enrollment and an even better 20.8 percent increase in credit hours. A year ago, graduate enrollment in the School of Engineering was up 6.6 percent.
Here’s the graduate-level enrollment and credit hours, and the percent change from last year, for St. Thomas’ seven colleges and schools:
| Program | Enrollment | % Change from 2014 | Credit hours | % Change from 2014 |
| College of Arts and Sciences | 122 | +3.4 | 502 | -5.6 |
| Opus College of Business | 993 | -4.2 | 6,161.5 | -5.2 |
| School of Divinity | 117 | -8.6 | 1,268 | -15.6 |
| College of Education, Leadership & Counseling | 1,236 | -2.1 | 6,559 | -3.9 |
| School of Engineering | 769 | +18.7 | 3,898 | +20.8 |
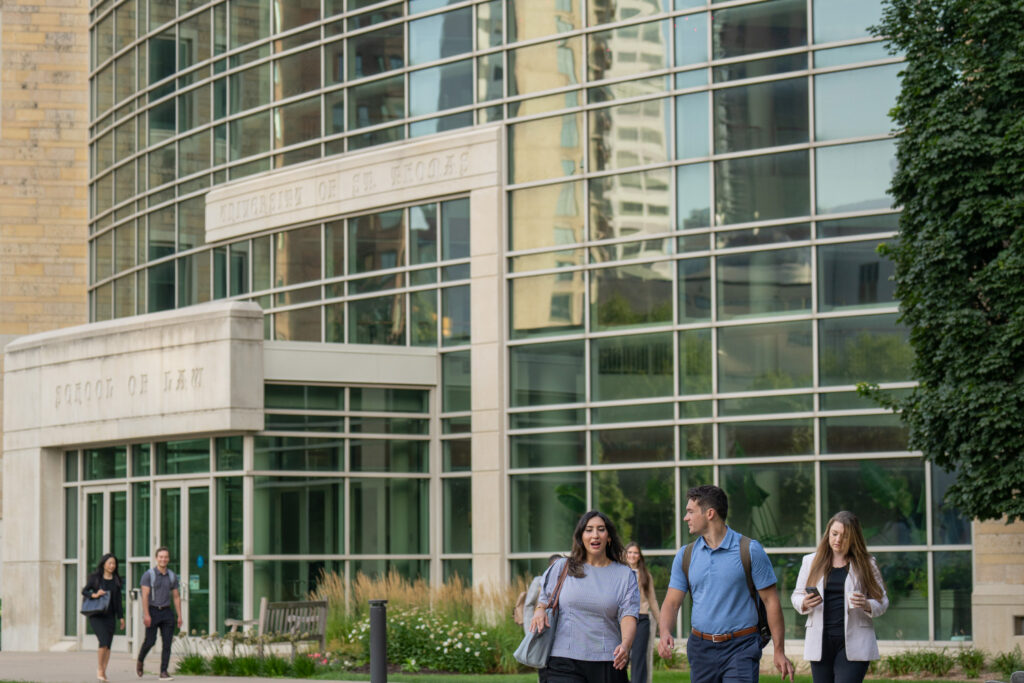
| School of Law | 385 | -5.4 | 5,397 | -6.2 |
| School of Social Work | 383 | -3.0 | 3,660 | -8.3 |
| Total | 4,005 | +0.3 | 27,445.5 | -3.1 |