Despite a small downturn in the median sale price of homes in the 13-county Twin Cities market, there was overall improvement in a new monthly index that uses nine data elements to measure the strength and health of the metro area’s residential housing market.
The Shenehon Center for Real Estate at the University of St. Thomas’ Opus College of Business today released its Minneapolis St. Paul Residential Real Estate Index for July. The index provides an overall score plus a second score for traditional, normal home sales and a third score for foreclosure and other distressed sales.
The median sale price for all Twin Cities homes dropped 3 percent from June to July, from $165,000 to $160,000. The July 2011 median price, meanwhile, was 8.5 percent less than in July 2010. When you only consider the sale price of traditional, normal sales, the median price decreased 1.5 percent from June to July, and decreased 10.4 percent from July 2010 to July 2011.
“This decrease in prices in the middle of the summer is somewhat troubling,” said Herb Tousley, director of real estate programs at St. Thomas. “July is normally a month when prices are peaking due to the seasonality of traditional home sales in our market. The prices will be watched carefully in future analyses to determine if the decrease in July was an anomaly or if it is the beginning of another downward slide in values.”
The St. Thomas index found positive news in the number of closed sales (up 34 percent over a year ago), the supply of homes on the market (decreasing over the past three months), and the percentage of foreclosure and distressed sales (holding steady at 38 percent, but down from higher levels last winter and spring).
While the selling price of a home is a key component of the St. Thomas index, other factors contribute to the composite score: the number of closed sales, the proportion of distressed to traditional sales, days on the market, month’s supply, number of pending sales, number of new listings, number of homes for sale, and the sale price as a percentage of the asking price.
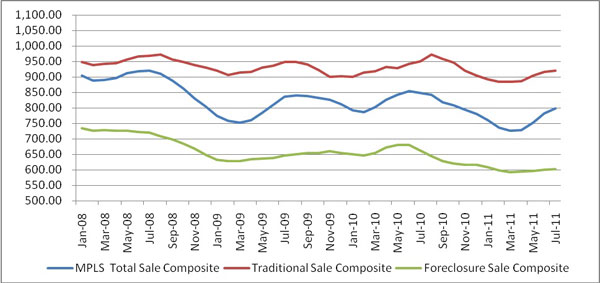
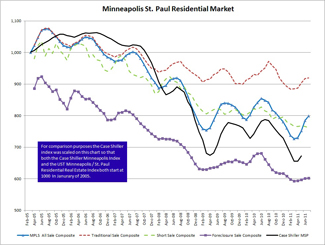
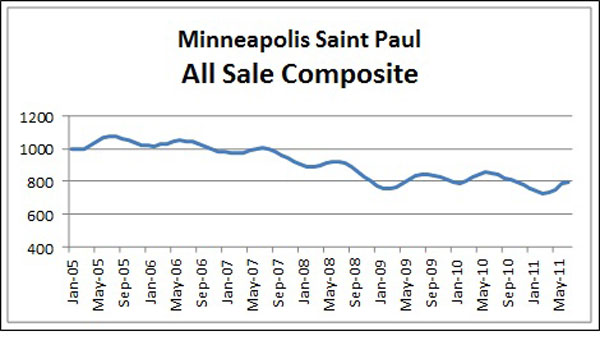
To allow month-to-month comparisons of residential real estate trends in the Twin Cities, St. Thomas assigned the baseline value of 1,000 to January 2005, a month that was near the apex of the residential housing bubble. When the nine data elements are combined, the St. Thomas composite index for all July sales was 799. That’s up from June’s 784 and was the fourth monthly improvement since March when the index hit its low point of 727.
The index for traditional normal sales in July was 920; that’s up from June’s 916 but down from 950 in July 2010. The index for foreclosure and distressed sales was 602 in July; that’s up from 601 in June but down from 661 in July 2010.
The St. Thomas index was developed to provide a more timely and detailed analysis of the Twin Cities residential real estate market than is available from the widely used Standard and Poor’s Case-Shiller Home Price Index.
The Case-Shiller index for July will not be available until September. It uses data from repeat sales of single-family homes. It does not distinguish, however between a traditional, normal market sale and a distressed sale. Traditional sales are those unaffected by foreclosure or the threat of foreclosure.
This is St. Thomas’ second monthly report. Its first showed that if you own a home or are selling a home that is not distressed, the value has not been impacted as much as less-detailed market data might indicate.
The monthly report, and a chart showing monthly changes since January 2005, can be found on the Shenehon Center for Real Estate’s website.
(To subscribe to a free, monthly index via e-mail, contact Tousley at hwtousley1@stthomas.edu.)
Research for the St. Thomas index was conducted by Tousley and Dr. Thomas Hamilton, associate professor of real estate at the university.