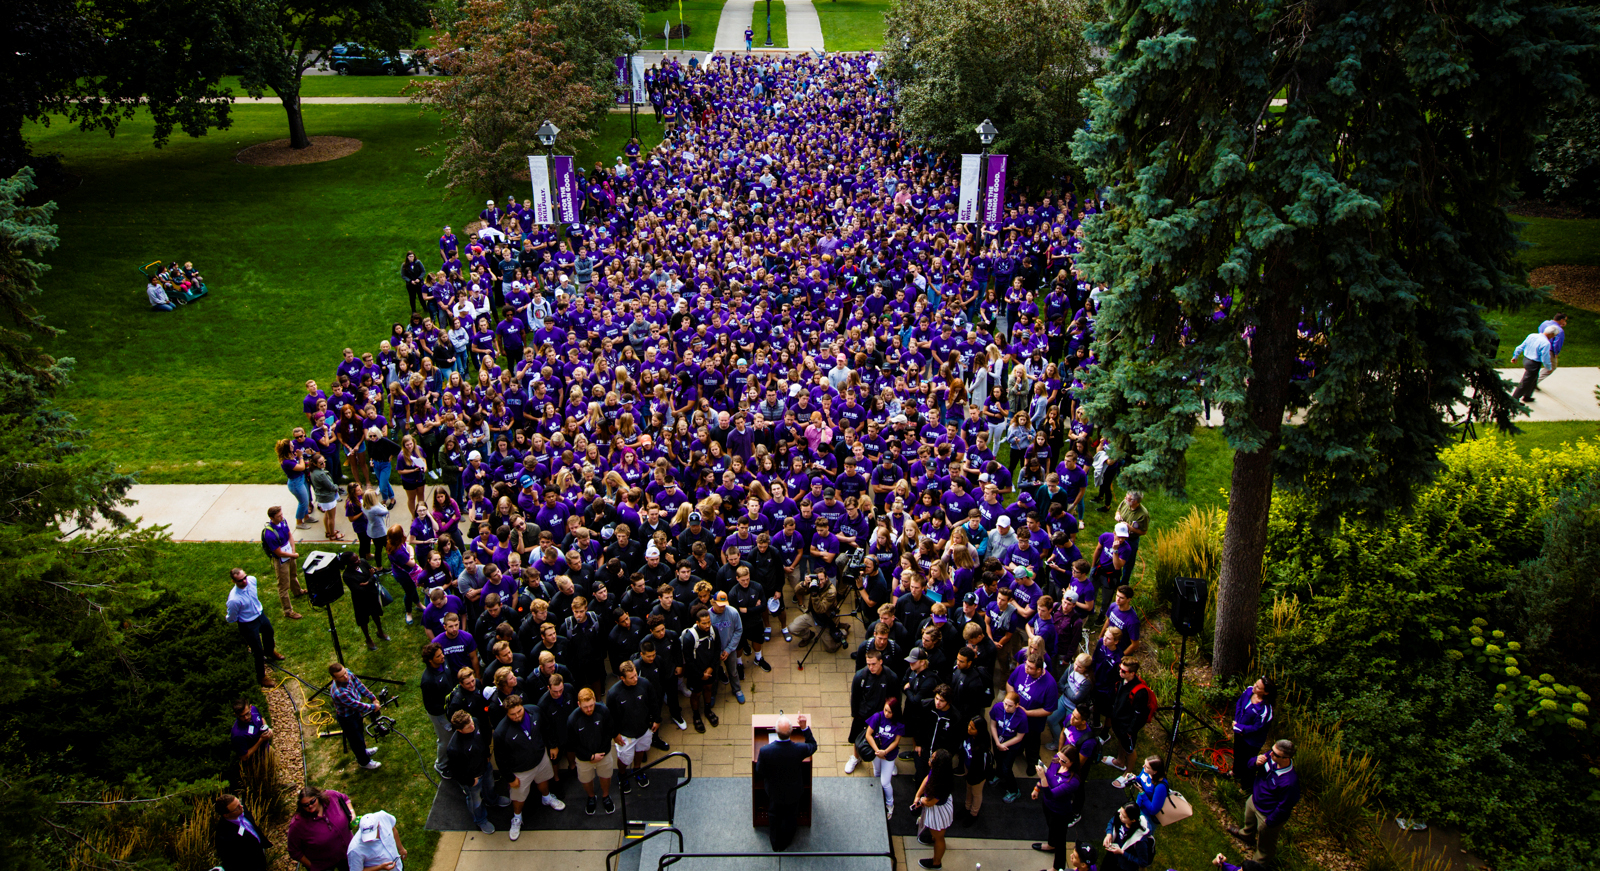
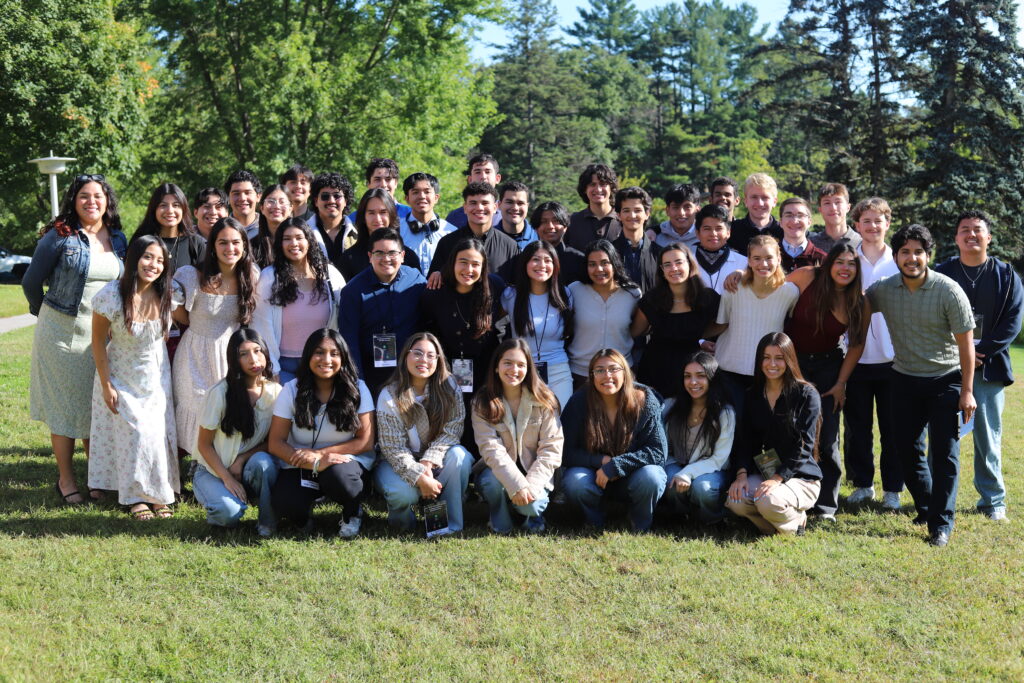
The freshman class maintains last year's record-setting academic profile and also is the most diverse class in the history of St. Thomas, with 16 percent students of color.
The 1,392 freshmen maintained last year's best academic profile with average ACT score of 27 and grade-point average of 3.6. In addition, 527 (38 percent) of the students in this new cohort earned advanced placement credits.
The overall students-of-color population has increased steadily in recent years and this fall stands at 18.4 percent, up from 16.8 percent in 2016, 16.4 percent in 2015 and 15.5 percent in 2014. The percentages of students of color are:
- 15.2 for undergraduates
- 88.2 for Dougherty Family College
- 22.0 for graduate students
The enrollment numbers for students of color are:
- 444 Hispanic (291 undergrad, 32 DFC and 121 graduate)
- 444 Black or African-American (154 undergrad, 37 DFC and 253 graduate)
- 462 Asian (230 undergrad, 11 DFC and 221 graduate)
- 275 who list two or more races (196 undergrad, 10 DFC and 69 graduate)
- 19 American Indian (10 undergrad and 9 graduate)
- 2 Hawaiian or other Pacific Islander (1 undergrad and 1 graduate)
The students-of-color numbers would be higher if international students were included. St. Thomas does not use the race of students from other countries when calculating the overall percentage of its students of color. This fall St. Thomas welcomed 567 new and returning international students (166 undergrads, 398 graduate students, three DFC students) from 65 countries. That’s an increase of 22 students from last year.
Overall enrollment is 9,878. Undergraduate enrollment is 6,199. Enrollment at the graduate level is 3,679, with the School of Law increasing 7.9 percent to 439 students. In terms of enrollment, engineering now is the largest graduate program (891 students). The Opus College of Business is now second largest with 883 students, and then College of Education, Leadership and Counseling (877 students).
The DFC has 107 students in its inaugural class. Sixty-three percent of the DFC students are female.
The total of undergraduate and graduate credit hours, which represents the number of courses that students are taking, is 118,338.5, an increase of .3 percent. At the undergraduate level, credit hours dropped .7 percent and at the graduate level, they dropped 2.8 percent. DFC has 1,171 credit hours this year.
Undergraduates at St. Thomas comprise 62 percent of all students but account for 76 percent of credit hours. Overall, 70 percent are full-time students.
This year’s freshman class continues a string of large classes that have kept undergraduate enrollments more than 6,000. Also helping is a healthy freshman-to-sophomore persistence rate: This year, 88.4 percent of last year’s freshmen have returned as sophomores.
The number of undergraduates who transferred to St. Thomas this fall is 257, up from 203 last year.
At a time when some colleges and universities are enrolling more women than men, the St. Thomas female-male ratio continues to show a near-even split. The percentage of students who are women is:
- 49.0 overall
- 46.2 for undergraduates
- 53.4 for graduate students
The top “majors of interest” indicated by the entering class are mechanical engineering; the business administration majors in marketing, general business management and financial management; pre-medicine; biology; psychology; entrepreneurship and accounting; and actuarial science.
The percentage of St. Thomas students who indicated they are Roman Catholic has been on a gradual decline. Overall, 36.0 percent are Catholic, down from 38.1 last year.
Enrollment on the St. Paul campus is 7,489. St. Thomas is limited to 8,750 students on its main campus under a Conditional Use Permit approved by the St. Paul City Council in 2004. The highest enrollment in St. Paul was 8,712 in 1991, the year before the university opened its Minneapolis campus.
For undergraduates, commuter students this fall outnumber resident students 3,565 to 2,514. A year ago, there were 3,654 undergraduate commuters and 2,440 residents.
Here’s the graduate-level enrollment and credit hours, and the percent change from last year, for St. Thomas’ colleges and schools:
| Program | Enrollment | % Change from 2016 | Credit hours | % Change from 2016 |
| College of Arts and Sciences | 119 | -6.3 | 514 | 1.2 |
| Opus College of Business | 883 | -1.1 | 5,604 | -0.2 |
| School of Divinity | 111 | -4.3 | 1,237 | -2.4 |
| College of Education, Leadership & Counseling | 877 | -16.3 | 5,022 | -15.8 |
| School of Engineering | 891 | -0.4 | 4,473 | -1.7 |
| School of Law | 439 | 7.9 | 6.128.5 | 8.5 |
| School of Social Work | 359 | -7. | 3,462 | -5.0 |
| Total | 3,679 | -5.0 | 26,440.5 | -2.8 |


