Home prices in the Twin Cities real estate market took an expected, seasonal dip in August, but in many respects the market is doing better than this time a year ago, according to the Residential Real Estate Price Report Index, a monthly analysis of the 13-county metro area prepared by the Shenehon Center for Real Estate at the University of St. Thomas’ Opus College of Business.
Each month the Shenehon Center tracks nine housing-market data elements, including the median price for three types of sales: nondistressed or traditional-type sales, foreclosures, and short sales (when a home is sold for less than the outstanding mortgage balance).
This year compared to last
In his analysis for the month of September, Herb Tousley, director of real estate programs at the university, said that “from August to September all of the market indicators for the Twin Cities housing market are showing the normal seasonality that we expect to see every fall.
 “September’s median sale prices and the number of closed sales, new listings and pending sales are all down from the August 2012 levels. What is important is that compared to a year ago most of these indicators continue to show a healthy increase,” he said.
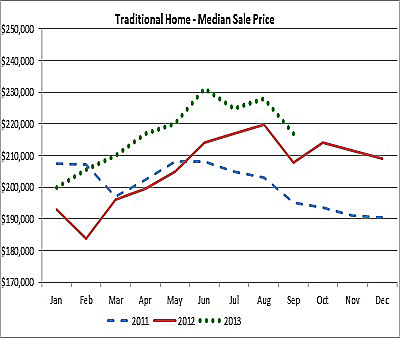
The median price of a traditional home in September 2013 was $217,000. That’s down $11,000 or 4.8 percent from the previous month, but is up $10,125 or 4.4 percent from September 2012.
“As we have reported previously, the annual rate of increase in the sale price of traditional homes (not foreclosures or short sales) is expected to moderate and remain in the 3 percent to 5 percent range for the remainder of the year,” Tousley predicted.
Low number of homes to buy helps boost prices
A factor that continues to put upward pressure on home prices is the historically low number of them for sale. In September there were 16,184 homes for sale in the 13-county area, which is 5.9 percent lower than the 17,197 homes available in September 2012.
“Historically the number of homes for sale peaks in mid-summer then declines through the fall, bottoming out in December,” Tousley said. “It appears that this year is following the same pattern, and the inventory of homes for sale will remain near all-time low levels.
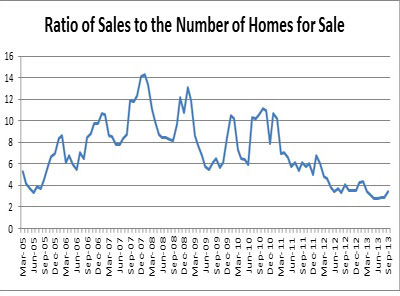 “As long as interest rates remain steady, look for the number of closed sales to continue to exceed last year’s levels. These conditions indicate that the market will continue to be tight through fall and winter into early spring,” he said.
Affordability and the price-to-income index
In this month’s report, the Shenehon Center for Real Estate looked at affordability and the price of homes compared to the income of homebuyers.
Tousley said the combination of low inventories of homes for sale, historically low interest rates and the perception of a slowly improving economy have been fueling the recent recovery in home prices.
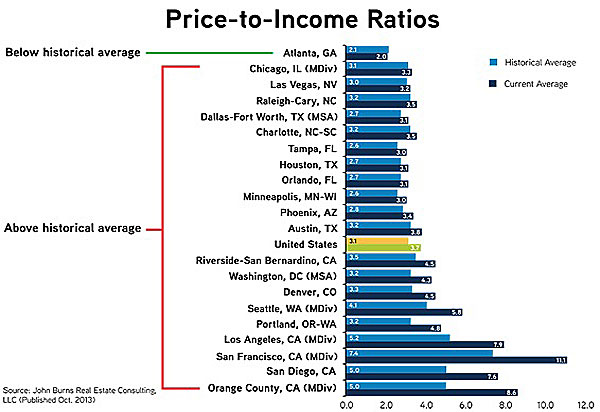
In many markets the increase in home prices has been outpacing growth in household income. The price-to-income ratio is a measure of affordability that compares the median price of homes to median household income.
“The price-to-income ratio has risen above its historical average in the Twin Cities and many other markets,” Tousley said.
“In the Twin Cities, historically the median price of a home has been 2.6 times the median household income. As year-over-year home prices have been increasing at a double-digit rate for a good share of the last two years, the ratio has now increased to 3.0. That puts our market in the middle of the pack compared to other major U.S. markets.”
He added that the price-to-income ratio is a good indicator of home ownership affordability and can be a predictor of a future housing bubble.
Home builders are busy
In September the number of construction permits for single-family homes continued to track about 30 percent ahead of last year. September saw about 3,800 permits issued for new single-family homes in the metro area. The dollar volume for those permits is running about 35 percent ahead of last year.
“This indicates that there are not only more homes being built but on average the homes being built this year are more expensive than they were last year,” Tousley said.
The St. Thomas indexes
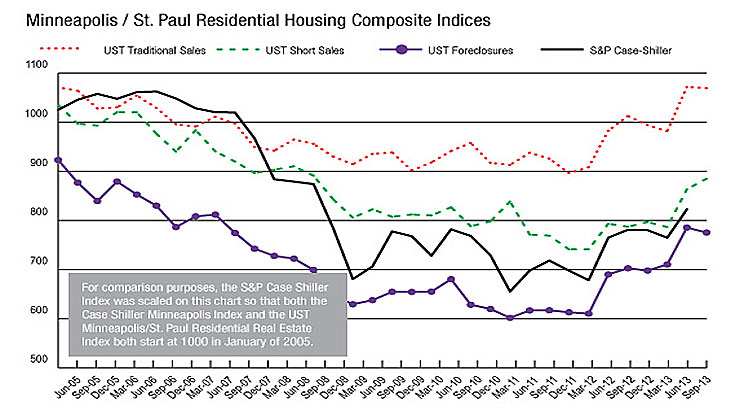
The St. Thomas Traditional Sale Composite Index, the one that tracks nine data elements, came in at 1,070 for September. That’s 20 points lower than August’s 1,090 (the highest recorded level since August 2005) but like most of the real estate measures, it is running well ahead of September 2012 when it was 1,012.
Composite indexes for the distressed sales also are improving over last year. The foreclosure index for September 2013 of 775 is up 10.2 percent from September 2012. The short sale index for September 2013 of 885 is up 12.2 percent from September 2012.
Research for the monthly reports is conducted by Tousley and Dr. Thomas Hamilton, associate professor of real estate at the university. The index is available free via email from Tousley at hwtousley1@stthomas.edu.