An analysis of the 13-county Twin Cities real estate market data for the month of October 2014 found a 7.1 percent overall increase in median sale prices compared to October 2013. However, virtually all of the increase has been due to higher prices paid for homes with foreclosed mortgages. Traditional home sales, which are those not affected by foreclosures or short sales, were up only .7 percent over October 2013.
Each month the Shenehon Center for Real Estate at the University of St. Thomas’ Opus College of Business looks for real estate trends in the Twin Cities and tracks the median price for three types of sales: nondistressed or traditional; foreclosures; and short sales (when a home is sold for less than the outstanding mortgage balance).
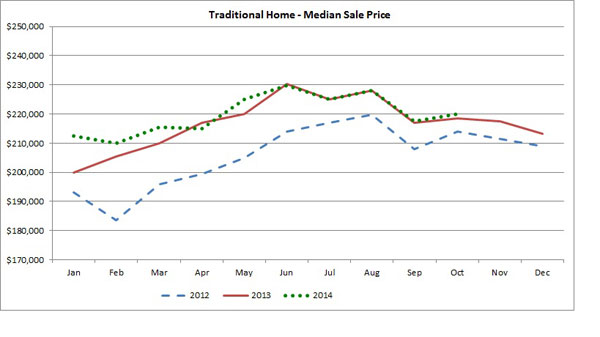
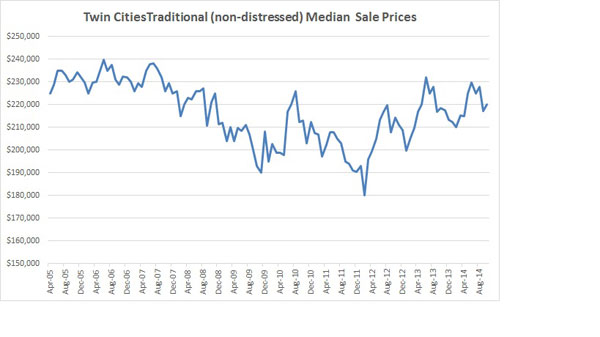
Since April 2014, the median price for traditional sales has been tracking very close to last year’s levels.
 “For all three types of sales, we had been expecting an annual median sale price increase in 2014 of 4 percent to 6 percent. However, we expected the majority of the increase would come from traditional sales dues to an improving economy and continued low interest rates,” said Herb Tousley, director of real estate programs at the university.
He added that in the Twin Cities the median price of traditional home sales by October had recovered to the pre-housing-crash levels of the second quarter of 2005. “With an improving local economy and a relatively low supply of homes for sale we are expecting that the median price of traditional homes should be running about 4 percent to 5 percent above the previous year’s level.”
 While their sale prices have been going up, the number of foreclosed and short-sale homes on the market is expected to decrease. That’s because the number of new foreclosures has been decreasing steadily throughout 2014. In October 2014, for example, the percentage of distressed sales was 12.5 percent, compared to 21.5 percent in October 2013. Tousley predicts that the percentage will decline to 6 percent to 8 percent in 2015.
While the number of homes on the market has increased recently in the Twin Cities, by historical standards that number is still low. In October 2014 there were 17,132 homes for sale; normally there are 20,000 to 25,000 in any given month.
Tousley suggests several reasons for the persistent low inventory, even though more homeowners are considering selling now that values have rebounded over the last couple of years:
- The question is what homeowners will do after they have sold their home. That would turn them from sellers into buyers in a market that offers them limited choices for their replacement home and the fact that obtaining a new mortgage is still relatively difficult.
- Although the number of homeowners who are “under water” has decreased significantly, there still are a considerable number who are near negative equity. Even if they are not under water, they have very little equity and when they sell their home they do not have enough money to buy a new one.
- Two additional factors that could be keeping potential sellers on the sidelines are more restrictive credit standards and little-to-no wage growth in the last several years.
Meanwhile, many homeowners are opting to stay and renovate or add on to their current homes as an alternative to moving. According to the Keystone Report, the number of permits for residential remodels and additions through the end of October are both up 46 percent.
“Most remodelers remain confident that the market will continue to improve as more homeowners undertake renovations and additions,” Tousley said.
While 2014 has been good for remodelers, it hasn’t turned out as well for those who build single-family homes. “Many builders were expecting 20 percent to 25 percent gains in 2014 and are now struggling to build the same number of homes they built last year,” he said.
This year, the number of single-family building permits issued through the end of October was down 9.5 percent and the dollar value of those permits was down 4.5 percent compared to the same period in 2013.
In 2013 there were just under 6,000 single-family housing starts. At this point we are on pace for about 5,500 single-family starts for the year.
One reason for the slower pace, Tousley said, has been the difficulty for builders to find quality lots in desirable locations. Another is that the median sale price of new homes has been increasing more rapidly than the median sale price of existing homes. This has been blamed on a significant increase in the cost of building materials in recent years and a trend to building larger, higher-price homes.
“The gap between the median sale price of new construction and existing single-family homes has been widening steadily since 2007, creating an affordability gap between new homes and existing homes,” he said.
The UST composite indexes
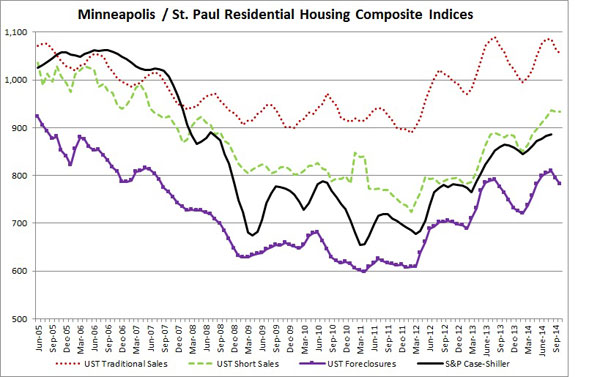
Each month the Shenehon Center tracks nine housing-market data elements, including the median price for three types of sales, and creates an index for each: nondistressed or traditional-type sales; foreclosures; and short sales.
The October composite index for traditional sales is 1055, which is the same as October 2013 and a decrease of 1 percent from September 2014 when the index was 1065. The decline is blamed on the decrease in the number of homes on the market and a significant drop in the number of new listings in September.
The October composite index for short sales was 993, down slightly from the 934 recorded in September. This index has increased 6.2 percent compared to one year ago.
The October composite index for the foreclosure market decreased 1.7 percent, moving from 795 in September to 782 in October.
More information online
The Shenehon Center’s charts and report for October can be found here.
The index is available free via email from Tousley at hwtousley1@stthomas.edu.