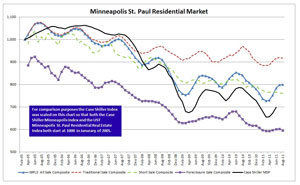
An index that uses nine data elements to measure the overall health of the 13-county Twin Cities market showed little change from July to August. It did reveal some good news – that number of sales are up, and some bad news – median home prices decreased at a time of year when they should be the most robust.
The Shenehon Center for Real Estate at the University of St. Thomas’ Opus College of Business today released its Minneapolis St. Paul Residential Real Estate Index for August. The index provides an overall score plus a second score for traditional, normal home sales and a third score for foreclosure and other distressed sales.
To gauge how the market is doing, St. Thomas’ index assigned the baseline value of 1,000 to January 2005, a month that was near the apex of the residential housing bubble.
Here’s how August 2011 stacks up compared to last month and last year:
- All Sale Composite Index: This went up a single point from July, from 799 to 800. This month’s overall score is 4.88 percent lower than August 2010, which was 841.
- Traditional Sale (normal home sales) Index: This fell three points from July, from 920 to 917. This score is 5.46 percent lower than August 2010, which was 970.
- Foreclosure Sale Index: This fell six points from July, from 602 to 596. This score is 7.60 percent lower than August 2010, which was 645.
A chart showing monthly changes since January 2005 can be found on the Shenehon Center for Real Estate’s website.
“The median price on traditional homes sales recorded its second-consecutive month decrease. This is concerning since prices normally reach their highest levels in the spring and summer,” said Herb Tousley, director of real estate programs at St. Thomas. “Without a recovery in September and October, it does not bode well for fall and winter, when prices and sales are normally softer.”
Tousley explained that one factor behind the decrease in median price is that the percentage of lower-prices homes, compared to higher-priced homes, was much higher in August 2011 than August 2010.
“Since January 2005 (near the height of the bubble) the sale price of homes of more than $308,000 when calculated on a per-square-foot basis have only declined about 11 percent, while homes that sold for less than $150,000 are down almost 50 percent.”
Tousley found some hints of possible improvements down the road.
The number of “closed sales” was substantially higher, compared to last year, and the month’s supply and days-on-the-market have been trending downward for the last several months.
As he noted earlier, Tousley said people who are selling homes that are not under the threat of foreclosure have not been impacted as much as less-detailed market data might indicate.
While the selling price of a home is a key component of the St. Thomas index, other factors contribute to the composite score: the number of closed sales, the proportion of distressed to traditional sales, days on the market, month’s supply, number of pending sales, number of new listings, number of homes for sale, and the sale price as a percentage of the asking price.
The St. Thomas index was developed to provide a more timely and detailed analysis of the Twin Cities residential real estate market than is available from the widely used Standard and Poor’s Case-Shiller Home Price Index. That index does not distinguish between a traditional, normal market sale and a distressed sale.
(To subscribe to a free, monthly index via e-mail, contact Tousley at hwtousley1@stthomas.edu.)
Research for the St. Thomas index was conducted by Tousley and Dr. Thomas Hamilton, associate professor of real estate at the university.


