The chronic shortage of homes available to buy in the 13-county Twin Cities region – especially moderately priced homes – is expected to improve but not overnight, according to a monthly analysis conducted by the Shenehon Center for Real Estate at the University of St. Thomas’ Opus College of Business.
Each month the center tracks the median price for three types of sales: nondistressed or traditional; foreclosures; and short sales (when a home is sold for less than the outstanding mortgage balance). In addition, it looks for trends in the market and creates a monthly composite index score by tracking nine data elements for those three types of sales.
How bad is the home shortage?
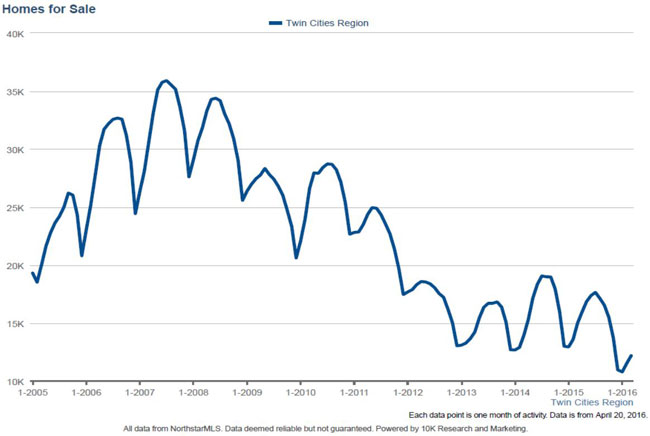
According to Herb Tousley, director of real estate programs at the university, there were 12,179 homes on the market in March. That compares to 14,983 homes in March 2015, and compares to the 25,000 to 30,000 homes that typically were on the market back in the pre-crash years of 2005-07.
Tousley’s report for March lists three reasons for the current home drought:
- Homeowner’s equity still has not completely recovered from the Great Recession and crash in housing values. Despite three years of steady price increases, some homeowners still owe more than their house is worth.
- A somewhat greater number of homeowners, meanwhile, have “near negative equity,” which means that while they are not technically underwater, if they sold their home they would not have enough equity to move up to their next home.
- And then there are some homeowners who know they could easily sell their current home, but are concerned about finding their next home under current market conditions.
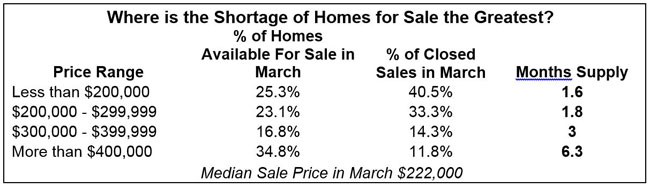
The shortage is most acute for lower- to moderately priced homes. In a normally balanced market there typically is a six-month supply of homes. Right now there is less than a two-month supply of homes being sold for less than $200,000 and between $200,000 and $300,000.
Will this change, and when?
“As median sale prices continue to increase, the equity position for all homeowners will improve,” Tousley said. “That should encourage more homeowners to list their homes for sale, improving the supply situation.
“The short-supply situation will take time to correct itself and our expectation is that it will slowly improve through the end of 2016. In the meantime, continued low interest rates and improving economic conditions will keep buyers active in the market,” he said.
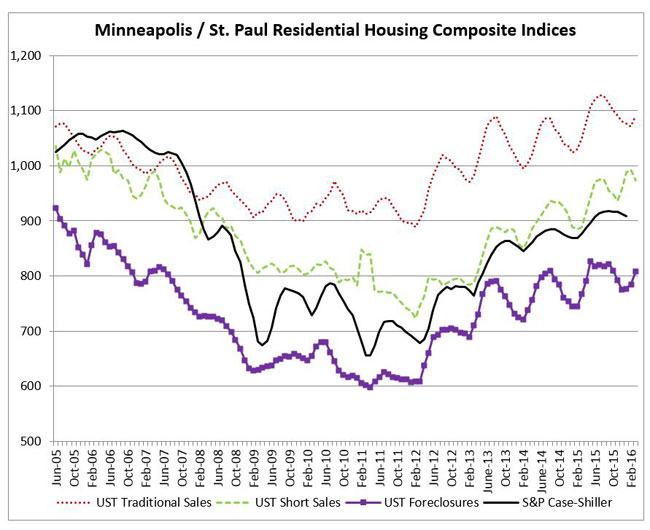
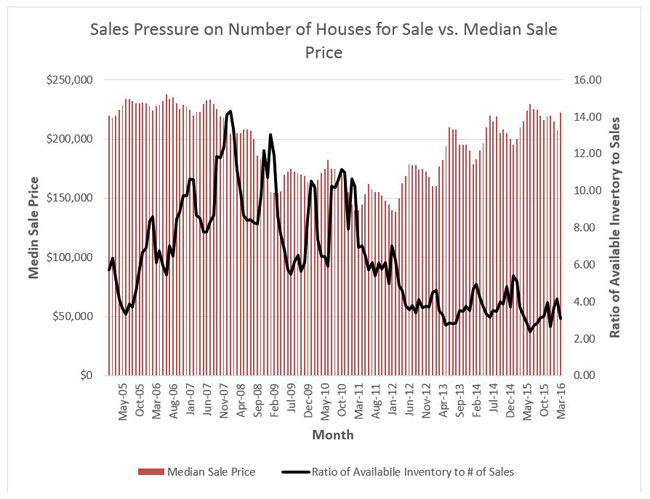
The Shenehon Center updated its graph that illustrates the historical relationship in the Twin Cities between the number of homes for sale, the number of homes sold and the median sale prices. The graph shows that when the market gets tighter – or in other words when buyers increasingly outnumber sellers – the median sale price of homes increases.
The graph can be seen below and also on the Shenehon Center’s online report for March here. The entire monthly report also is available free via email from Tousley at hwtousley1@stthomas.edu.
The St. Thomas indexes
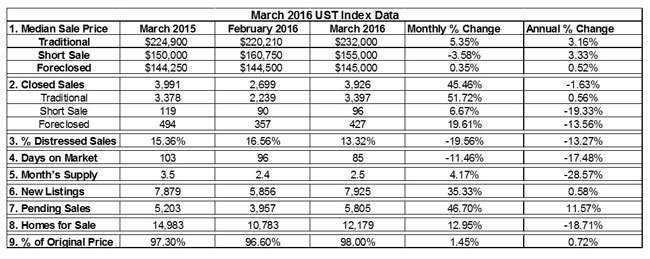
Here are the Shenehon Center’s monthly composite index scores for March 2016. The index, which tracks nine data elements for the three types of sales (traditional, short sales and foreclosures), started in January 2005. For that month, the center gave each of the three indexes a value of 1,000.
- The March 2016 index score for traditional sales was 1,091, up 1.9 percent from February 2016 and up 4.6 percent from March 2015.
- The March 2016 index score for short sales was 973, down 2 percent from February 2016 but up 10 percent from March 2015.
- The March 2016 index score for foreclosures was 808, up 2.9 percent from February 2016 and up 5.8 percent from March 2015.
There are far fewer distressed sales now than there were during the height of the Great Recession. In March, the 96 short sales represented 2.5 percent of total sales and the 427 foreclosure sales represented 10.9 percent of total sales.
“The 4.6 percent year-to-year increase in our traditional-sale composite index is an indicator of the continued health and resurgence of the Twin Cities housing market,” Tousley said.