A strong first half of 2015 -- and an especially robust second quarter -- has for the most part returned the Twin Cities housing market to a level of health not seen here since the pre-crash years of 2005 and 2006.
Each month the Shenehon Center for Real Estate at the University of St. Thomas’ Opus College of Business looks for real estate trends in the 13-county Twin Cities region and tracks the median price for three types of sales: nondistressed or traditional; foreclosures; and short sales (when a home is sold for less than the outstanding mortgage balance).
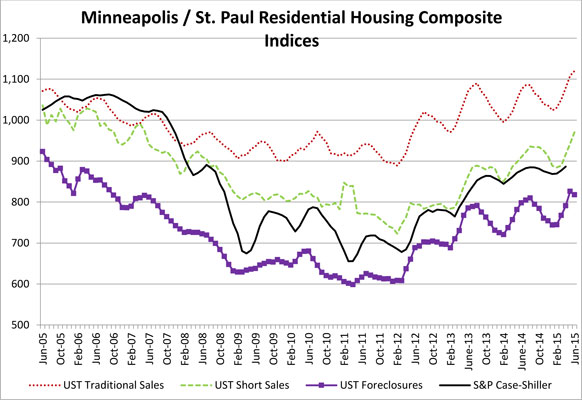
Additionally, as part of its analysis, the center creates a monthly index score by tracking nine data elements for those three types of sales, including categories like the number of closed sales, how many days homes are on the market, and what percent of the asking price sellers receive. The researchers started the index at January 2005 and for that month gave each of the three indexes a value of 1,000.
For several years running, the Shenehon Center had to report some dismal news in its monthly analyses. Although there were both ups and downs along the way, the index for traditional homes (not short sales or foreclosures) dropped into the 900s in early 2007 and eventually bottomed out at 889 in February 2012.
The traditional home index has since rebounded and reached an all-time high in June 2015. “At a level of 1,120 the June index is the highest that has been observed since it was created in 2005,” said Herb Tousley, director of real estate programs at the university. The June 2015 index is up 4.2 percent from the same month a year ago, and is up 2.8 percent from May 2015.
 “This monthly increase is the continued result of both a relatively low number of homes available for sale and a significant increase in the number of buyers in the market,” Tousley said.
The St. Thomas researchers found six categories that had especially healthy numbers in June and contributed to that record-high composite index score:
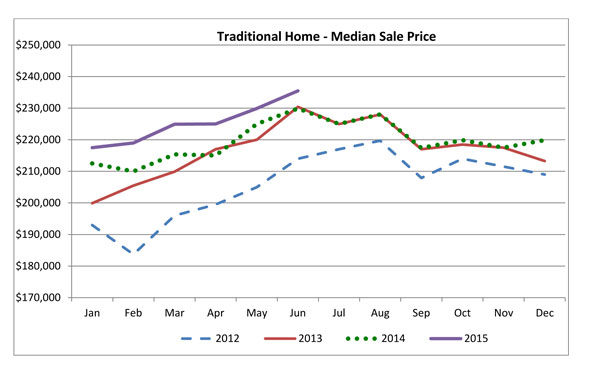
- Median price of all homes: The median price of the three types of sales (traditional, foreclosures and short sales) in June was $229,900, a level not seen since August 2007.
- Median price of traditional-sale homes: The median price for a traditional-type sale (not a foreclosure or short sale) in June was $235,500, also the highest since August 2007.
- Percent of distressed sales: The percent of distressed sales in June (foreclosures and short sales) was 7.7 percent of all sales. The percent has not been that low since mid-2007.
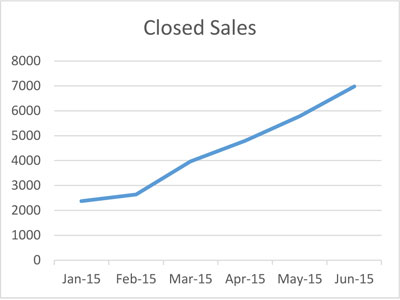
- Number of closed sales: The 6,980 closed sales in June was the highest number since the St. Thomas index was created in January 2005.
- Number of pending sales: The number of pending sales for the last 90 days was more than 6,200, the highest since spring 2005. This high number of pending sales indicates that the number of closed sales should remain strong for the rest of the summer.
- Sale price as percentage of asking price: In June the sale price as a percentage of the original asking price increased to 98.6 percent, a level not seen since spring 2005. The inventory of homes for sale at 16,718 in June remains historically low, and is one reason for a higher number of multiple offers and, in some cases, homes that are sold for more than the asking price.
Construction of new homes
With such a shortage of homes on the market, the Shenehon Center checked on the number of new homes being built to meet the demand. It found that while there has been some improvement over the past three years, the number of single-family-home permits has been flat over the past year.
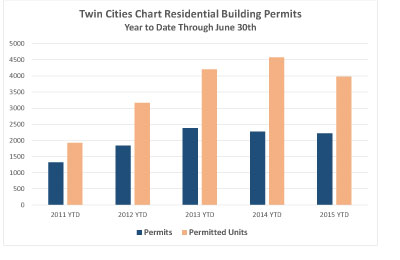 So far this year 2,224 permits were issued, compared to 2,270 for the first half of 2014. The dollar value of the permits, however, has increased from $319,254 per home last year to $335,295 this year.
“There are several factors that explain this increase,” Tousley said. “There has been a marked increase in the price of building materials such as concrete and drywall. Secondly, due to a shortage of quality buildable lots, land prices have also increased considerably.”
He said the average sale price of an existing home is $121 per square foot while the average sale price of a new home is $162 per square foot. That’s a 34 percent premium for a brand-new home.
“While many homebuilders have focused on building higher-priced homes because the profit margins are higher, the low supply of existing homes available for sale is creating a pent-up demand for construction of lower-priced homes,” Tousley said. “There are a number of homebuilders who are starting programs to profitably build entry-level homes that provide a bit more than the basics to entice first-time and entry-level buyers. An example of this is D.R. Horton’s Express Homes program. The company has been aggressively rolling out this program on a national basis as a way to add to the supply of moderately priced homes available for sale.”
More information online
The Shenehon Center’s charts and report for June can be found here.
The index is available free via email from Tousley at hwtousley1@stthomas.edu.