The current state of the real estate market in the 13-county Twin Cities region, including the historically low number of moderately priced homes available to purchase, is the result of several long-term trends that are expected to change slowly over time.
That’s the conclusion reached by the Shenehon Center for Real Estate at the University of St. Thomas’ Opus College of Business. The center examined the Twin Cities’ long-term trends, expected to continue through the end of 2017, in its monthly analysis of metro area real estate data.
“The historically low-supply-of-homes-for-sale situation has been with us for the last several years although it has been most acute since mid 2015,” said Herb Tousley, director of real estate programs at the university.
He cited five statistics that illustrate the housing supply-and-demand situation in the Twin Cities:
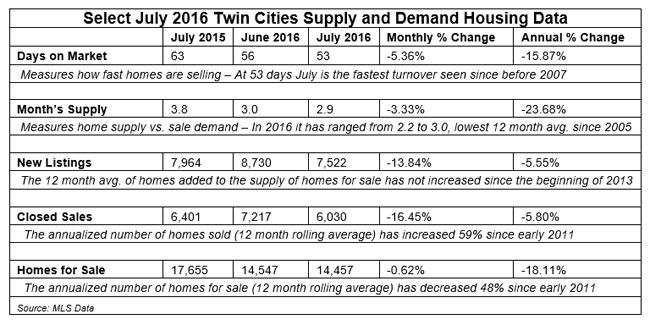
- Days on Market: It was 53 days in July. That’s 15 percent less than a year ago and the fastest turnover since 2007.
- Month’s Supply: It was 2.9 months in July. That’s 24 percent less than a year ago and the lowest 12-month average since 2005.
- New Listings: It was 7,522 in July. Down 14 percent from June and 6 percent from a year ago.
- Closed Sales: It was 6,030 in July. The annualized number of homes sold has increased 59 percent since early 2011.
- Homes for Sale: It was 14,457 in July. The annualized number of homes for sale has decreased 48 percent since early 2011.
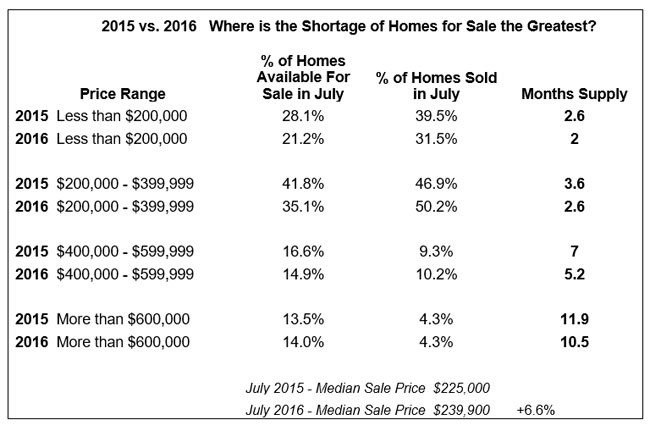
The shortage of homes is most pronounced for homes selling for less than $200,000 and for those selling between $200,000 and $399,000.
For example, in July there was only a two-month supply of homes selling for less than $200,000 and a 2.6-month supply for homes selling between $200,000 and $399,000. However, there was 5.2-month supply of homes selling between $400,000 and $599,000 and a 10.5-month supply of homes selling for more than $600,000.
Also in July, 56.3 percent of homes available for purchase were under $400,000 while 81.7 percent of homes sold were under $400,000.
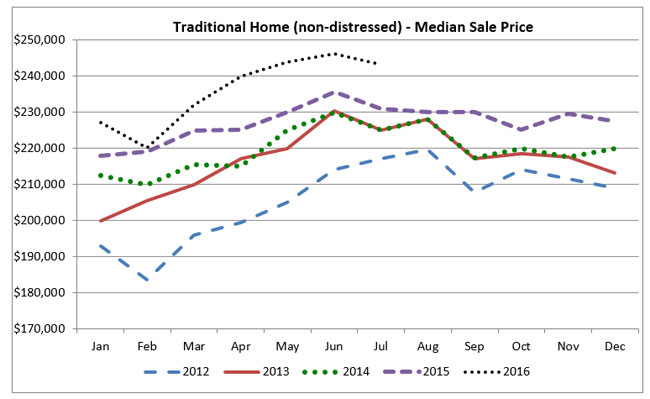
The median price for homes sold in the Twin Cities in July was $239,000. That’s down $6,000 from the all-time high median sale price of $245,900 that was set in June. However, it still is in record territory; the previous high was $238,000 set in June 2006.
Supply side trends
The Shenehon report cited these long-term underlying trends on the supply side of the Twin Cities market.
- Americans are keeping their homes longer. CoreLogic reported recently that the number of years that homeowners owned their homes increased by three between 2007 and 2013 and it has increased an additional year since then.
- The homeownership rate in the Twin Cities, as reported by the U.S. Census Bureau, was 68.6 percent in the second quarter of 2016. That’s the highest rate of any major metro area in the nation. Nationally, the rate is 62.9 percent.
“Since we have a very high ownership rate and homeowners are keeping their homes longer, the result is fewer existing homes being listed and a shortage of homes available for sale,” Tousley said.
Demand side trends
According to this month’s Shenehon report, “On the demand side the simple answer is that people want to live here.”
- The Twin Cities population has been increasing and is expected to increase for at least the next 10 to 15 years. This is mainly due to migration from rural areas and other parts of the country, and immigration.
- Housing is affordable. According to a recent Bloomberg News report, the Twin Cities area ranks fourth in the top 10 list of most affordable places for people between the ages of 24 and 44 to purchase a home.
“These people are going to need a place to live here,” Tousley said. “Our diverse economy, strong job growth and high median income attracts people to the area.
“Favorable economic conditions coupled with historically low interest rates and an increasing number of potential home buyers will continue to create strong demand for single-family homes.”
How long will the shortage last?
According to the Metropolitan Council, the Twin Cities region had 1,176,600 owned or rented households in 2015, up almost 59,000 since 2010. During that time, however, only 43,000 housing units were added. The remaining 16,000 new households moved into existing housing, and that in turn reduced the vacancy rate.
“This growth pattern is expected to continue for at least the next five years,” Tousley said. “It is unlikely that we will be able to build our way out of this situation in the near term.
“Single-family home builders have not yet returned to pre-recession production levels. Over the last several years there has been a great deal of multi-family construction but much of this new product has been high-end luxury units, beyond the financial reach of many households.
“For the housing market to become more balanced between buyers and sellers we are going to have to add a significant number of affordably priced rental and for-sale housing units.
“These units need to be affordable to households who earn the area median income in order to keep up with the expected population growth in the Twin Cities market area. As this happens the market should begin to slowly come back into balance.
“However, this is a process that is going to take a number of years and until then we should expect similar market conditions to what we have experienced over the last couple of years.
“In the meantime, expect to see solid annual price appreciation for existing homeowners. As you can see from the table below in the past year the supply of homes for sale has become even tighter, especially for homes are priced at less than $400,000.”
The St. Thomas indexes
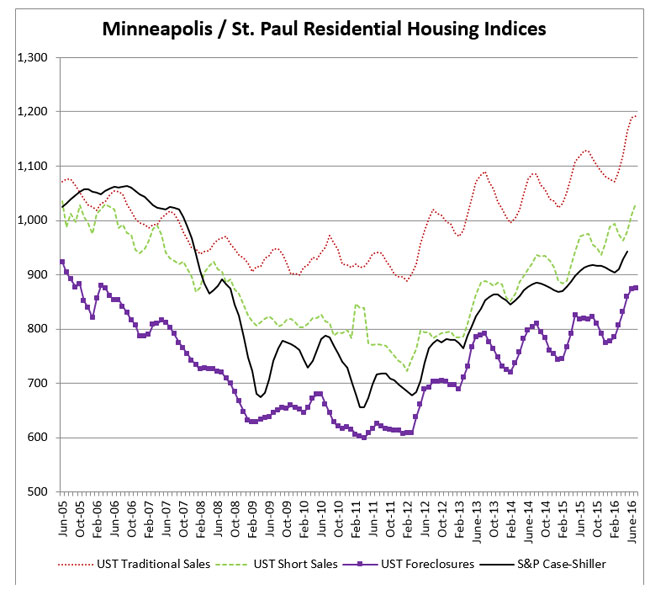
Here are the Shenehon Center’s monthly composite index scores for July 2016. The index, which tracks nine data elements for the three types of sales (traditional, short sales and foreclosures), started in January 2005. For that month, the center gave each of the three indexes a value of 1,000.
- The July 2016 index score for traditional sales was 1,192, up 0.3 percent from June 2016 and up 5.7 percent from July 2015.
- The July 2016 index score for short sales was 1,031, up 2.1 percent from June 2016 and up 5.9 percent from July 2015.
- The July 2016 index score for foreclosures was 875, which is unchanged from June 2016 and up 7.1 percent from July 2015.
For the third consecutive month, the score for traditional sales set new record highs. “Although the increase was small in July, it is the result of a continuing tight supply of homes for sale coupled with very low interest rates,” Tousley said in Shenehon Center’s July report.
More information online
The Shenehon Center’s complete online report for July can be found on its website.
The report is available free via email from Tousley at hwtousley1@stthomas.edu.