 The spirit of holiday giving is alive and well in the Twin Cities, according to research conducted by marketing professors at the University of St. Thomas.
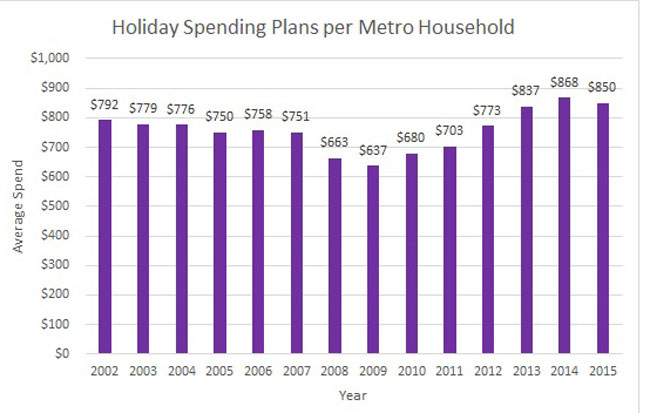
Metro region shoppers are planning to spend $850 per household this holiday season. That’s the second-highest amount since the St. Thomas Holiday Sentiment Survey began 14 years ago. It’s down $18, or 2.1 percent, from 2014 but is up $223 or 33 percent from the survey’s recession-era low point in 2009.
While the predicted household-dollar amount dropped $18, when shoppers were asked in general terms if they’d spend more or less, their answers were actually more optimistic than last year. About 1 percent more said they would increase spending (18 percent this year compared to 17 percent last year), and about 2 percent fewer said they would spend less (22 percent this year compared to 24 percent last year). That compares to the financially gloomy days of 2009, when 54 percent said they’d spend less and 8 percent said more.
Fifty-nine percent this year said they’d spend about the same, while in 2009 39 percent said they’d spend the same.
The annual survey is conducted in late October and early November and provides data on Twin Cities holiday shopping trends. The survey measures the intent of Twin Cities shoppers: how much they think they will spend for holiday gifts, what they will spend it on, and where they will spend it.
The research is conducted by Dr. Dave Brennan, Dr. Lorman Lundsten, Dr. Sandra Rathod and Jonathan Seltzer at St. Thomas’ Opus College of Business.
“It might seem unusual to see this year’s household-spend amount down while the spending-intent numbers are up. However, both of these changes are slight and fall within the margin of error,” Brennan said. “We can say that the responses were similar to last year’s survey, which was the most optimistic since we began measuring shopping intent in 2002. We also can say the responses are substantially more optimistic than those recorded six or seven years ago, in the depth of the recession.”
Generally tracking the path of the recession, the survey’s decline in predicted spending first appeared in 2008 and was especially pronounced from 2008 to 2010. Except for this year’s 2.1 percent dip of $18, there have been steady, incremental gains in predicted holiday spending per household since the 2009 lowpoint of $637.
From 2002 to 2009, the St. Thomas study mirrored or painted a slightly more pessimistic holiday shopping picture than national surveys. From 2010 to 2013, St. Thomas’ data was more optimistic. This year and last, the university’s predicted household spending is lower than national predictions: for 2015, Deloitte & Touche is predicting a 3.5 to 4 percent increase, the National Retail Federation is predicting 3.7 percent, and Nielson is predicting 1.9 percent.
Based on survey responses and the population of the greater Minneapolis-St. Paul metro area, the researchers predict that metro-region shoppers will cumulatively spend $1.14 billion this year, down 1.2 percent from last year’s $1.15 billion. Like the per-household survey prediction, this year’s metrowide prediction is the second-highest in the 14 years of the survey. And it is up 40 percent, or $326 million, from the cumulative spend predicted back in the recession of 2009. The metrowide prediction decline from last year is less than the household decline because even though individual households are spending a little less, there are more households because of population growth in the Twin Cities.
Survey respondents said they had completed 19 percent of their shopping by Nov. 1 and predicted they would have 52 percent of their shopping wrapped up by Dec. 1. Those percentages are similar to responses in previous years.
The St. Thomas professors who conducted the study emphasize that actual spending might be different because shoppers could spend more or less than they planned once they get into the stores or online.
A peek under the tree
What will Twin Cities shoppers buy with their $850? The professors created an index to analyze the relative popularity of 14 gift categories. It sheds light on the “what’s hot” question and allows year-to-year comparisons.
The perennial frontrunners did not change significantly, with shoppers picking gift certificates, cash and books as their top choices this year. The biggest change this year was the computer category, which dropped from sixth place last year to 12th place this year. In fact, the three somewhat related categories -- computers, consumer electronics and video games – all dropped at least some in the rankings and all are near the bottom of the 2015 list.
“There’s nothing exciting going on in the world of electronics,” Rathod said. “And that is reflected in the survey responses.”
“We haven’t detected any must-have gift this year,” Seltzer said. “The closest thing might be a drone, but those are expensive and consumers are still waiting to learn more about how they will be regulated. While we see them in the news, they probably won’t be given as all that many holiday gifts.”
With the top choices being gift certificates or cash, does that mean shoppers are growing weary of selecting more personal gifts?
“When it comes to gifts, the most important are those we give to our spouses or significant others, and also to little kids,” Brennan said. “In those cases, you don’t see many gifts of cash. But for the other people in our lives, especially teenagers, it’s easier to give cash or gift certificates. Another reason for this is that when people grow up and leave home, they tend to move around the country more than ever, so it’s easier to send them cash or gift cards.”
“When you select a noncash gift, you are saying that you love that person enough to take a chance on buying them something,” Lundsten added. “You can enrich the relationship by getting it right, or you also run the risk of giving the wrong kind of gift, like one that is the wrong size or won’t be used.”
Here’s how this year’s survey respondents ranked their gift choices, listed with most popular at the top:
- Gift certificates (last year 1)
- Cash (last year 3)
- Books (last year 7)
- Clothing/accessories (last year 2)
- Entertainment (last year 8)
- Travel (last year 4)
- Toys and hobbies (last year 5)
- Sporting goods (last year 9)
- Jewelry (last year 14)
- Cell or mobile phones (last year 10)
- Furniture/furnishings (last year 13)
- Consumer electronics (last year 11)
- Computer related (last year 6)
- Video game related (last year 12)
Where They Spend
For the past 14 years the survey has asked shoppers where they plan to spend their money. This year's results show that shopping malls remain popular but for the first time they are almost tied with the Internet.
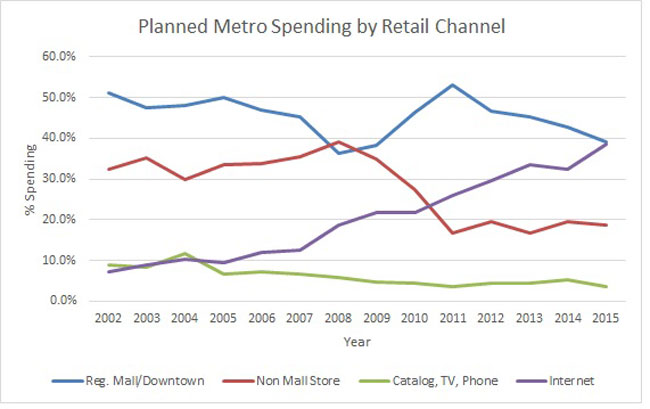 When St. Thomas began its survey in 2002, respondents said they would spend 51 percent of their holiday budget at shopping malls or downtowns and 7 percent via the Internet. Fourteen years later, respondents said they’d spend 39.1 percent at the malls and 38.5 percent via the Internet. Compared to last year, the malls dropped four percentage points and the Internet gained six percentage points.
Other shopping categories also have lost ground to the Internet. In 2002, respondents said they’d spend 32 percent of their money at non-mall stores and in 2015 it was 19 percent. For the category that combines catalogs, television ads and phone sales, respondents said 9 percent in 2002 and 4 percent in 2015.
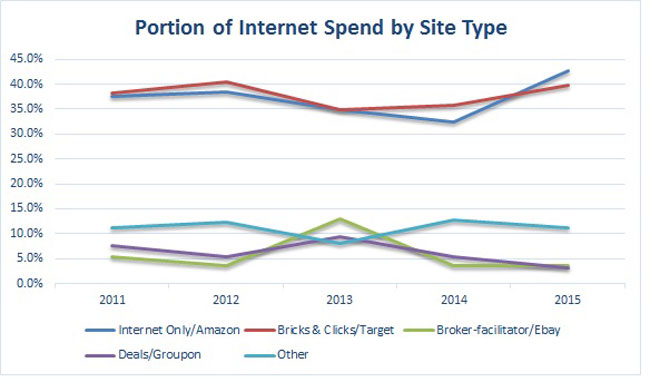
To find out what kind of Internet sites are most popular with shoppers, researchers asked respondents to indicate what portion of their Internet spending would be done on four kinds of online sites:
- “Internet only” sites, such as Amazon, received 43 percent (last year 33 percent).
- “Bricks and clicks” sites, operated by stores such as Target, received 40 percent (last year 36 percent).
- “Broker-facilitator” sites, such as eBay, received 4 percent (same as last year).
- “Deals” sites, such as Groupon, received 3 percent (last year 5 percent).
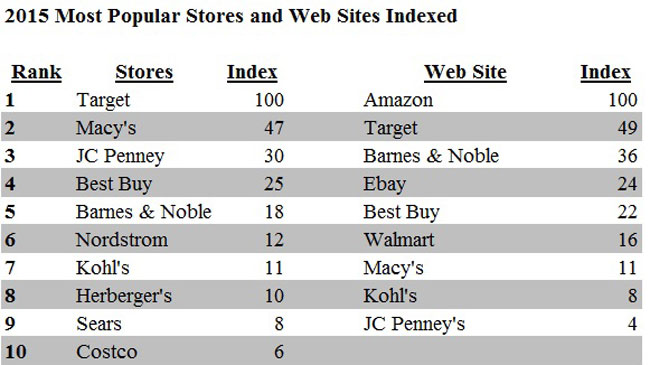
 Again this year, respondents were asked to list two stores and two websites where they planned to shop.
In the store category the five most popular, in order, were Target, Macy’s, JC Penney, Best Buy and Barnes & Noble.
In the website category, the five most popular were Amazon, Target, Barnes & Noble, eBay and Best Buy.
In 2013 and 2014, Amazon was mentioned nearly six times more often than second-place Target. This year, Amazon was mentioned twice as often as Target.
Most-popular malls and shopping areas
Which of the 16 enclosed malls, outdoor shopping centers and downtowns are going to attract the most shoppers?
The researchers approached that question from two perspectives: first, which mall in the region are consumers planning to visit at least once for holiday shopping; second, which mall are they planning to shop at most for the holidays. The results are not the same.
When asked which malls or downtowns they planned to visit at least once for their holiday shopping, survey respondents listed, from most-popular to least-popular (Note: use caution when comparing this year’s numerical rank to last year’s numerical rank because this year there were several ties and last year there were none) :
1. Mall of America (last year 1)
2. Rosedale (last year 2)
3. Southdale (last year 3)
3. Burnsville (last year 6)
4. Eden Prairie (last year 4)
5. Ridgedale (last year 5)
6. Twin Cities Premium Outlets (last year 7)
7. Maplewood (last year 10)
7. Arbor Lakes Area (last year 9)
7. Riverdale Area (last year 15)
8. Woodbury Lakes Area (last year 8)
8. Galeria (last year 13)
9. Downtown Minneapolis (last year 12)
10. Albertville Premium Outlets (last year 14)
11. Northtown (last year 11)
12. Downtown St. Paul (last year 16)
The Mall of America, Rosedale and Southdale have held these one-two-three rankings for the past six years, as well as 13 years ago when the survey began. The Mall of America has been the top, shop-at-least-once-for-the-holidays mall for all 14 years with the exception of 2004-2006 when Rosedale was No. 1.
When asked where they planned to do most of their holiday shopping this year, respondents listed, in order (note that there are two ties this year):
1. Rosedale (last year 1)
2. Mall of America (last year 2)
3. Eden Prairie (last year 4)
4. Southdale (last year tie for 7)
5. Ridgedale (last year 3)
6. Burnsville (last year tie for 7)
6. Maplewood (last year 5)
7. Woodbury Lakes area (last year 8)
8. Arbor Lakes area (last year 9)
9. Riverdale area (last year 6)
10. Twin Cities Premium Outlets (last year 14)
11. Northtown (last year 10)
11. Downtown Minneapolis (last year 11)
12. Albertville Premium Outlets (last year 12)
13. Galleria (last year 13)
14. Downtown St. Paul (last year 15)
This is the 11th time in the 14 years of the survey that Rosedale finished No. 1 in the most-shopped list. The Mall of America has held it three times.
What the research tells us
“While our data tell us that Twin Cities residents are in a shopping mood that is generally comparable to last year, I think we are seeing a plateau,” Brennan said. “We have seen family holiday budgets increase year after year since the 2008-2009 recession, but eventually it becomes more difficult to keep increasing a larger and larger amount, especially when increases in wages are not keeping pace. So this year we saw a small drop in the household spend number, from $868 to $850. Because of the possible margin of error, we see this as more of a leveling off than a drop in planned spending.”
Noting that the survey’s projected holiday-spend in the Twin Cities is less optimistic than most national forecasts, he said there could be some softness in the metro-area mood because of well-publicized layoffs at Target and 3M, a stock market that had a shaky late summer and fall, questions about what the Federal Reserve will do with interest rates, minimal pay raises this past year and a general uncertainty about the nation’s future that often is associated with presidential elections.
According to its annual holiday prediction, Deloitte LLP said U.S. shoppers may be cautious this year because of the low growth in hourly wages, slow global growth and financial-market volatility. Deloitte predicted up to a 4 percent increase in U.S. retail sales this holiday season.
While it is hard to measure, the St. Thomas professors note that the exceptionally warm fall has not helped to put shoppers in a holiday mood.
“There are fewer days than usual this year between Thanksgiving and Christmas,” Seltzer said. “Expect to see some heavy advertising for sales on Black Friday, and on Thanksgiving Day itself.”
“Some of the promotions started back in August and September with layaway plans at stores like Kmart and Walmart,” Brennan said. “What we sometimes call Christmas creep, with earlier and earlier retail promotions, is alive and well.”
The researchers
Brennan, Lundsten, Rathold and Seltzer are members of the Opus College of Business faculty.
Brennan, who holds his Ph.D. from Kent State University, is a professor of marketing and co-director of the university’s Institute for Retailing Excellence. He teaches retailing and marketing strategy.
Lundsten is a professor emeritus of marketing who taught marketing research and strategy. He holds a doctorate from the University of Michigan.
Rathod, whose Ph.D. is from Purdue University, is the Opus College of Business Distinguished Service Professor. She teaches marketing strategy, consumer behavior, communication research and applied business research.
Seltzer teaches international marketing and distribution channels. A former vice president of industry and government relations at Supervalu Inc., he holds an M.B.A. from the University of Chicago.
The Institute for Retailing Excellence, part of the Opus College of Business, conducts research and offers educational programs for those who work in retailing.
Survey method
This year’s holiday spending survey included 307 online responses from households in the 13-county Minneapolis-St. Paul Metropolitan Statistical Area, which includes two counties in western Wisconsin. The respondents reflect the demographics of the area as well as those who responded to previous holiday spending surveys.