The persistent low availability of homes for sale, coupled with strong demand, will result in a 5 percent increase in the median sale price of homes in the 13-county Twin Cities region in 2017. That compares to a 4.1 percent increase in the median sale price recorded in 2016.
That’s the conclusion reached by the Shenehon Center for Real Estate at the University of St. Thomas’ Opus College of Business in its most recent analysis of metro area real estate data.
“The historically low supply of homes, which has been most acute since mid-2015, will continue to fuel the median sale price increase throughout the coming year,” said Herb Tousley, director of real estate programs at the university. “However, the amount of increase will be tempered by an increase in the number of new homes built as home builders bring the number of new housing starts to more normal levels.”
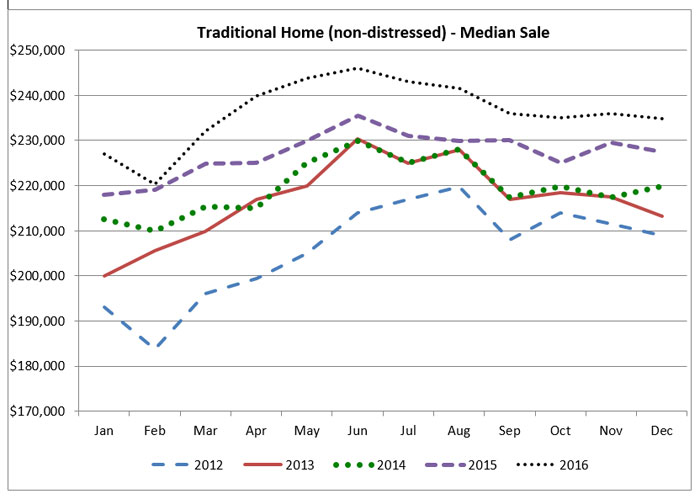
The median sale price of a home in the Twin Cities in December 2015 was $219,500. In December 2016 it was $228,500. Last year, 60,033 homes were sold in the 13-county region. That was considered a good year for sales, and Tousley expects about that many to be sold again in 2017.
About a decade ago, before the housing-market crash, there typically were in excess of 20,000 homes available for sale at any given time in the Twin Cities. Last year there were between 11,000 and 15,000 homes available, and in 2017, Tousley expects the range will be between 12,000 and 16,000.
Here is a look at the shortage based on the price of homes in December 2016.
- Homes less than $200,000: These represented 24 percent of homes on the market but 38 percent of sales. There was a 1.1-month supply.
- Homes between $200,000 and $400,000: These represented 40 percent of homes on the market but 47 percent of sales. There was a 1.4-month supply.
- Homes between $400,000 and $600,000: These represented 19 percent of homes on the market but 11 percent of sales. There was a 3-month supply.
- Homes more than $600,000: These represented 18 percent of homes on the market but 4 percent of sales. There was a 6.5-month supply.
Affordable Twin Cities
“Based on the composite housing affordability index, the Twin Cities housing market continues to be one of the most affordable major metro housing markets in the nation,” Tousley said.
That index, developed by the National Association of Realtors, measures the degree to which a typical family can afford the monthly mortgage payments on a typical home. An index of 100, for example, means that a family has exactly enough income to qualify for a mortgage on a median-priced home. An index of 120 would mean the family has 120 percent of the necessary income and could afford the home more easily.
The Twin Cities has an affordability index score of 217.
The scores of some of the least-affordable markets are: San Jose, 64; San Francisco, 73; Los Angeles, 74; New York, 84; and Naples, Florida, 89.5.
The scores of some of the most-affordable markets are: Denver, 129; Chicago, 192; Indianapolis, 244; Cleveland, 245; and Des Moines, 248.
The St. Thomas indexes
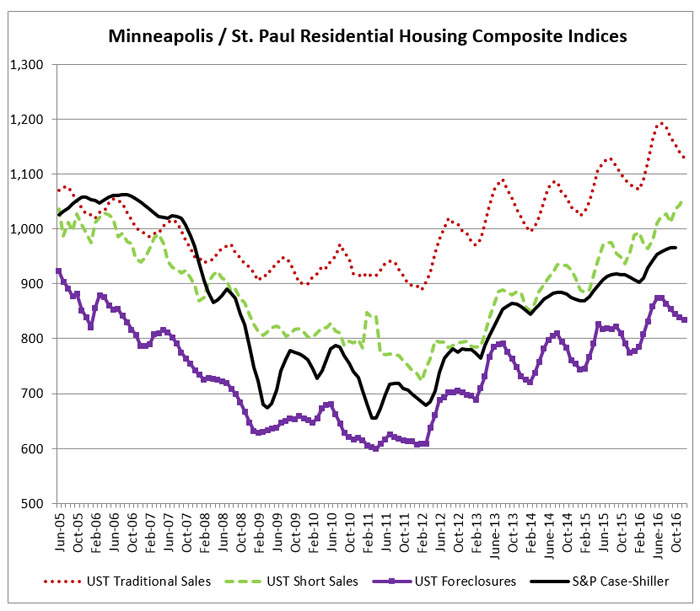
Here are the Shenehon Center’s monthly composite index scores for December 2016. The index, which tracks nine data elements for the three types of sales (traditional, short sales and foreclosures), started in January 2005. For that month, the center gave each of the three indexes a value of 1,000.
- The December 2016 index score for traditional sales was 1,114, down 0.8 percent from November 2016 and up 4.6 percent from December 2015.
- The December 2016 index score for short sales was 1,058, up 1.3 percent from November 2016 and up 10.5 percent from December 2015.
- The December 2016 index score for foreclosures was 834, down 0.5 percent from November 2016 and up 7.7 percent from December 2015.
There were months during the height of the housing market crash when more than half of all sales in the Twin Cities were “distressed sales,” meaning they were either short sales or foreclosures. They now have returned to pre-crash levels. In December 2016, there were only 67 short sales (1.6 percent of the total) and 225 foreclosures (5.4 percent of the total).
More information online
The Shenehon Center’s complete online report for December can be found here.
The report is available free via email from Tousley at hwtousley1@stthomas.edu.