Household holiday spending predicted to be highest in survey history
Optimistic Twin Cities holiday shoppers are continuing to rebound from their recessionary slump, according to research conducted by marketing professors at the University of St. Thomas.
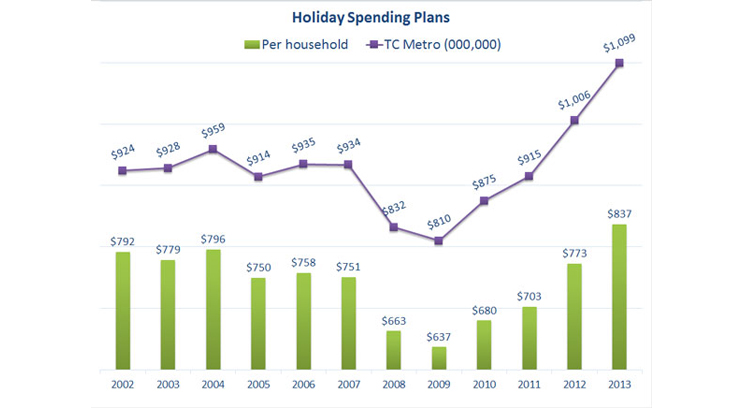
Shoppers here are planning to spend $837 per household this holiday season. That’s the highest amount since the St. Thomas Holiday Sentiment Survey began 12 years ago. It’s up $64 or 8.3 percent from 2012, up $134 or 19 percent from 2011, and up $200 or 31 percent from the survey’s low point in 2009.
The annual survey is conducted in late October and early November and provides longitudinal data on Twin Cities holiday shopping trends. The survey measures the intent of Twin Cities shoppers: how much they think they will spend for holiday gifts, what they will spend it on, and where they will spend it.
The research is conducted by Dr. Dave Brennan, Dr. Lorman Lundsten, Dr. John Sailors and Jon Seltzer at St. Thomas’ Opus College of Business.
Generally tracking the path of the recession, the survey’s decline in predicted spending first appeared in 2007 and was especially pronounced from 2008 to 2010. There was a slight gain of 3 percent in 2011 and a much stronger gain of 10 percent in 2012.
According to the survey, 29 percent of shoppers said they would spend less this year and 13 percent said more. That compares to last year when fewer (21 percent) said less and more (18 percent) said more. In 2008, during the recession, 54 percent said less and 4 percent said more.
This year the researchers asked shoppers four questions related to the economy and their pocketbooks. When asked “How are you getting along financially these days?” 76 percent said the same or better. When asked how they will be doing in the coming year, 89 percent said the same or better. They were evenly split when asked if they had been significantly affected by the recession; 48 percent said yes and 51 percent said no. And when asked if this is a good time to buy a large item for the house, only 16.5 percent said yes.
In its first eight years, the St. Thomas study mirrored or painted a slightly more pessimistic shopping picture than national surveys. For the past four years, St. Thomas’ data has been more optimistic. The university’s predicted increase in household spending of 8.3 percent compares to the nationally projected increases by Deloitte & Touche at 4 to 4.5 percent, the National Retail Federation at 3.9 percent and the International Council of Shopping Centers at 3.4 percent. At the high end of national predictions, Acenture predicts an 11 percent increase and at the low end, Shopper Trak is predicting just 2.4 percent.
Based on survey responses and the population of the greater Minneapolis-St. Paul metro area, the researchers predict that metro-region shoppers will cumulatively spend $1.1 billion this year, up 9.2 percent from last year’s predicted $1.01 billion. Like the per-household survey prediction, this year’s metro-wide prediction is the highest in the 12 years of the survey.
The St. Thomas professors who conducted the study emphasize that actual spending might be different because shoppers could spend more or less than they planned once they get into the stores or online.
A peek under the tree
What will Twin Cities shoppers buy with their $837? The professors created an index to analyze the relative popularity of 14 gift categories. It sheds light on the “what’s hot” question and allows year-to-year comparisons.
The list did not change significantly this year, with shoppers again picking perennial frontrunners: gift certificates, clothing and cash. Categories that moved up the most were toys, books and jewelry; categories that moved down the most were computers, furniture and travel.
The categories, listed with most popular at the top:
- Gift certificates (last year 1)
- Clothing/accessories (last year 2)
- Cash (last year 4)
- Books (last year 6)
- Toys/hobbies (last year 7)
- Travel (last year 3)
- Entertainment (last year 8)
- Video games/related items (last year 9)
- Computers/related items (last year 5)
- Sporting goods (last year 11)
- Consumer electronics (last year 13)
- Jewelry (last year 14)
- Cell phones, related items (last year 12)
- Furniture/furnishings (last year 10)
Where they spend
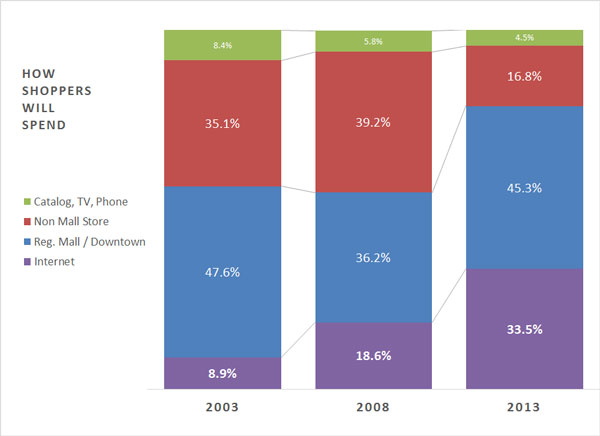
For the past 12 years the survey has asked shoppers where they plan to spend their money. This year's results show that shopping malls remain popular – accounting for nearly half of all shopping – but they and nonmall stores continue to give up ground to the Internet.
Respondents plan to spend 45 percent of their holiday budget at the region’s 14 malls and two downtown areas. That’s down from 47 percent last year and a high of 53 percent in 2011.
They will spend 17 percent at nonmall stores this year. That’s down from 20 percent last year and a high of 39 percent in 2008.
The Internet continues to make gradual but steady inroads. This year shoppers plan to spend 34 percent of their holiday budget by going online. That’s up from 30 percent in 2012 and the highest percentage in the survey’s 12-year history. In 2002, when the survey began, it was just 7 percent.
Catalogs, meanwhile, will account for 4.5 percent of this year’s shopping dollar. That’s unchanged from last year, but down from 12 percent predicted back in 2004.
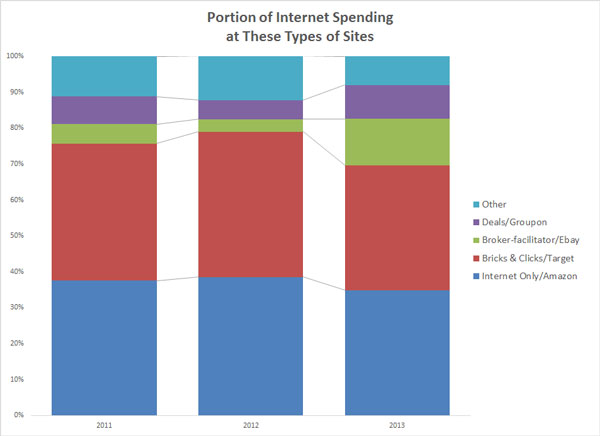
What kind of Internet sites are most popular with shoppers? To find out, researchers asked respondents to indicate what portion of their spending would be done on four kinds of online sites:
- “Bricks and clicks” sites, operated by stores such as Target, received 35 percent, down from last year’s 41 percent.
- “Internet only” sites, such as Amazon, were also at 35 percent, down from last year’s 39 percent.
- “Deals” sites, such as Groupon, registered 9 percent, up from last year’s 5 percent.
- “Broker-facilitator” sites, such as eBay, registered the biggest gain with 13 percent, up from last year’s 4 percent.
Again this year, respondents were asked to list two stores and two websites where they planned to shop.
In the store category: Target and Kohl’s were the winners, followed by Macy’s, JC Penney, Walmart, Best Buy, Herberger’s, Gap, Barnes and Noble, and Victoria’s Secret.
(Last year, the top five were Target and Macy’s, which were tied for first, followed by Best Buy, Herberger’s and Kohl’s.)
In the online category: Amazon was mentioned nearly six times more often than second-place Target. Rounding out the top five were eBay, Best Buy and Kohl’s.
(Last year the top five were Amazon, Target, eBay, Best Buy and Barnes & Noble.)
Most-popular malls and shopping areas
Which of the 14 malls and shopping areas (including the two downtowns) are going to attract the most shoppers?
The researchers approached that question from two perspectives: first, which mall in the region are consumers planning to visit at least once for holiday shopping; second, which mall are they planning to shop at most for the holidays. The results are not the same.
When asked which malls or downtowns they planned to visit at least once for their holiday shopping this year, survey respondents listed, from most-popular to least-popular (note: there are some ties this year and last):
- Mall of America (last year 1)
- Rosedale (last year 2)
- Southdale (last year 3)
- Burnsville (last year 8)
- Maplewood (last year 10)
- Eden Prairie (last year 7)
- Riverdale (last year 12)
- Ridgedale (last year 4)
- Arbor Lakes area (last year 9)
- Northtown (last year 12)
- Woodbury Lakes area (last year 11)
- Albertville Outlet Center (last year 5)
- Downtown Minneapolis (last year 6)
- Downtown St. Paul (last year 12)
The Mall of America, Rosedale and Southdale have held these one-two-three rankings for the past four years, as well as 12 years ago when the survey began. The Mall of America has been the top, shop-at-least-once-for-the-holidays mall for all 12 years with the exception of 2004-2006 when Rosedale was No. 1.
Malls that moved up the list most this year were Maplewood, Riverdale, Burnsville and Northtown. Sites that moved down most were Albertville, downtown Minneapolis and Ridgedale.
When asked where they planned to do most of their holiday shopping this year, respondents listed, in order:
- Mall of America (last year 1)
- Rosedale (last year 2)
- Maplewood (last year 10)
- Burnsville (last year 4)
- Southdale (last year 9)
- Ridgedale (last year 3)
- Eden Prairie (last year 5)
- Woodbury Lakes area (last year 7)
- Riverdale area ((last year 8)
- Arbor Lakes area (last year 6)
- Downtown Minneapolis (last year 11)
- Northtown (last year 13)
- Albertville Outlet Center (last year 12)
- Downtown St. Paul (last year 14)
This is only the third time Rosedale didn’t finish No. 1 in the most-shopped list and only the third time Mall of America held the top spot.
Malls that moved the most up the list were Maplewood and Southdale. Malls that moved down the most were Arbor Lakes area, Ridgedale and Eden Prairie.
What the research data tells us
“Our 12 years of survey data trace the mood of Twin Cities shoppers before, during and after the recession,” Brennan said. “It was essentially a two- or three-year event here, from about 2008 to 2010, but a longer one nationally. We snapped back faster, and I think farther, than the nation.”
“I think this year’s survey tells us that shoppers have an enthusiastic ‘we’re ready to go’ attitude,” Lundsten added. “We saw an improvement in attitude from 2011 to 2012, and that has continued this year. The improving economy is allowing many to spend what they have wanted to spend.”
Regarding the national-level spending predictions, which tend to be lower than the Twin Cities predictions, Brennan said he tends to trust those than come in at around 3 percent or 4 percent, as opposed to those much higher or lower.
Both professors feel this will be a “highly promotional year,” fueled in part by the shorter, 26-day shopping season between Black Friday and Christmas Eve. In many stores, they noted, holiday promotions appeared immediately after Halloween.
“They are locked into a shorter season, so look for lots of sales this year,” Lundsten predicted. “I think you’ll start seeing them even before Thanksgiving.”
One indication that holiday shoppers are already busy is that when they took the St. Thomas surveys in late October and early November, respondents already had completed 21.4 percent of their shopping. That compares to 16.5 percent last year and 17 percent the year before.
The professors are watching the new phenomenon of retail stores opening at various times on Thanksgiving. “No doubt that is going to make many store employees unhappy,” Lundsten said.
“Thanksgiving is much more about family; there is no other holiday like it,” Brennan said. “On the other hand, for many Christmas is more about gift-giving but it includes many other activities ranging from parties to decorations to going to church.
“I can see retailers being very busy on Thanksgiving,” he added. “Going shopping that day or evening as a family, or with part of your family, could become a new family tradition throughout the country.”
The researchers
Brennan, Lundsten, Sailors and Seltzer are members of the Opus College of Business faculty.
Brennan, who holds his Ph.D. from Kent State University, is a professor of marketing and co-director of the university’s Institute for Retailing Excellence.
Lundsten is a professor of marketing who teaches retailing and marketing research. He holds a doctorate from the University of Michigan.
Sailors is a specialist in consumer behavior, marketing research, and brand equity and loyalty; his doctorate is from Northwestern University.
Seltzer teaches international marketing and distribution channels. A former vice president of industry and government relations at Supervalu Inc., he holds an M.B.A. from the University of Chicago. He is teaching this semester in London.
The Institute for Retailing Excellence, part of the Opus College of Business, conducts research and offers educational programs for those who work in retailing.
Survey method
This year’s holiday spending survey included 297 online responses from households in the 13-county Minneapolis-St. Paul Metropolitan Statistical Area, which includes two counties in western Wisconsin. The respondents reflect the demographics of the area as well as those who responded to previous holiday spending surveys.